A few weeks ago in a post introducing the Quarterly Workforce Indicators (QWI) tool from the U.S. Census Bureau, we included a chart that gives an overview of industries in several West Michigan counties stratified by employee age. Today, we’d like to dig into those data a little deeper to see which industries in West Michigan have a significantly young or old workforce.
Using QWI Effectively
For this analysis, we used data reflective of firms with private ownership, a 4-quarter average from Q1-2016 to Q4-2016, and selected the four largest counties in West Michigan, Kent, Ottawa, Muskegon, and Allegan Counties. These largest counties were used so that we could pull accurate estimates for smaller industries (even after narrowing it to these counties, we still couldn’t get estimates for Mining, Quarrying, and Oil and Gas Extraction and Utilities because there are too few employees).
Age Groupings
The QWI Explorer allows users to view industry employee counts in 7 age buckets from 14 to 99, but for the chart below, we’ve aggregated those smaller buckets into four more meaningful groupings.
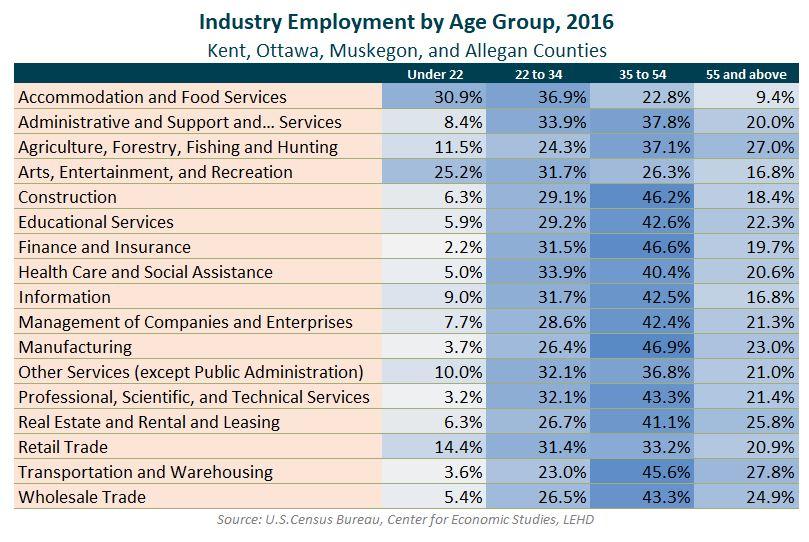
In this way, the data becomes more useful. Under 22 is likely going to be a mix of interns, seasonal employees, part-time students or other employees, as well as some students who entered the workforce after their secondary education. The age group from 22 to 34 then represents “early in career” talent, or individuals who are very likely to be in the first decade of their career. Ages 35 to 54 represents “experienced” talent, and importantly, the final bucket 55 and above would be the numbers to track with regards to “nearing retirement.”
Usefulness for Employers
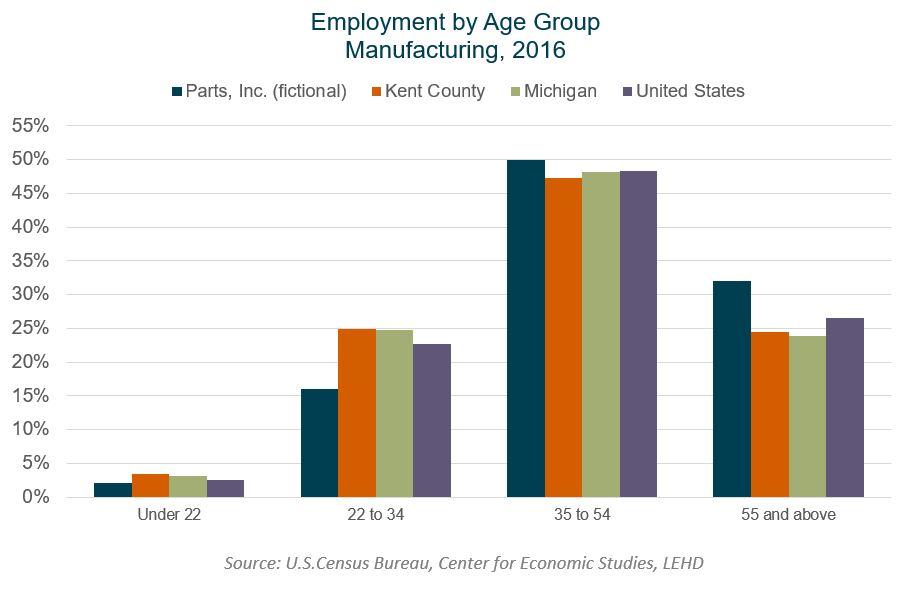
Are you interested in how this tool could be used by an employer? If you’re tracking metrics like the age of your workforce internally, a good exercise might be to see how that distribution stacks up to your industry on a county-wide, statewide, and national level. As an example, a manufacturer in Kent County could place their own data (I’ve used hypothetical data here) next to larger trends to show that they proportionally have more employees nearing retirement than their market as a whole.
Future Data Topics
Have you been enjoying these “Data Points” blogs and are interested in other data? Let us know what topics you’d like to know more about on our Twitter @WMTalent2025! We’d like to crunch some numbers that you’re interested in!