Median age, which is a metric provided with each year’s population estimates on a national, state, and county-wide level, is a helpful “one number” summary of an area’s age profile. Here, we’ll take a look at why it’s so useful, national and statewide trends, as well as what the median age looks like within our own region.
Why use median age
Median age very simply means that half the residents of a given area are older and half are younger than the number. Therefore, if the median age for an area is 37.9 (as it was in the United States in 2016), half of Americans are over the age of 37.9 while half are younger.
It is often useful to look at the complete distribution of residents by age, which can include single-year age counts (18-year-olds, 19-year-olds, etc.) or grouped counts (e.g. 65-years and older). While these can often give a very thorough picture of who lives in a given area, it is sometimes useful to compare areas using a single statistic, such as median age. Using this more simplified measure, we can compare this aspect of the populations of many areas at once, and even at different levels of geography.
What’s happening nationally
On a national scale (as is the case in many states), the median age rises as the Baby Boomer generation (generally defined as those born between 1946 and 1964) continues to age up. As this was a particularly large cohort of births for a period of time, this trend has been pulling up the median age for several years. This graphic from the U.S. Census Bureau gives a sense of how much the nation is aging, particularly since the start of the century.
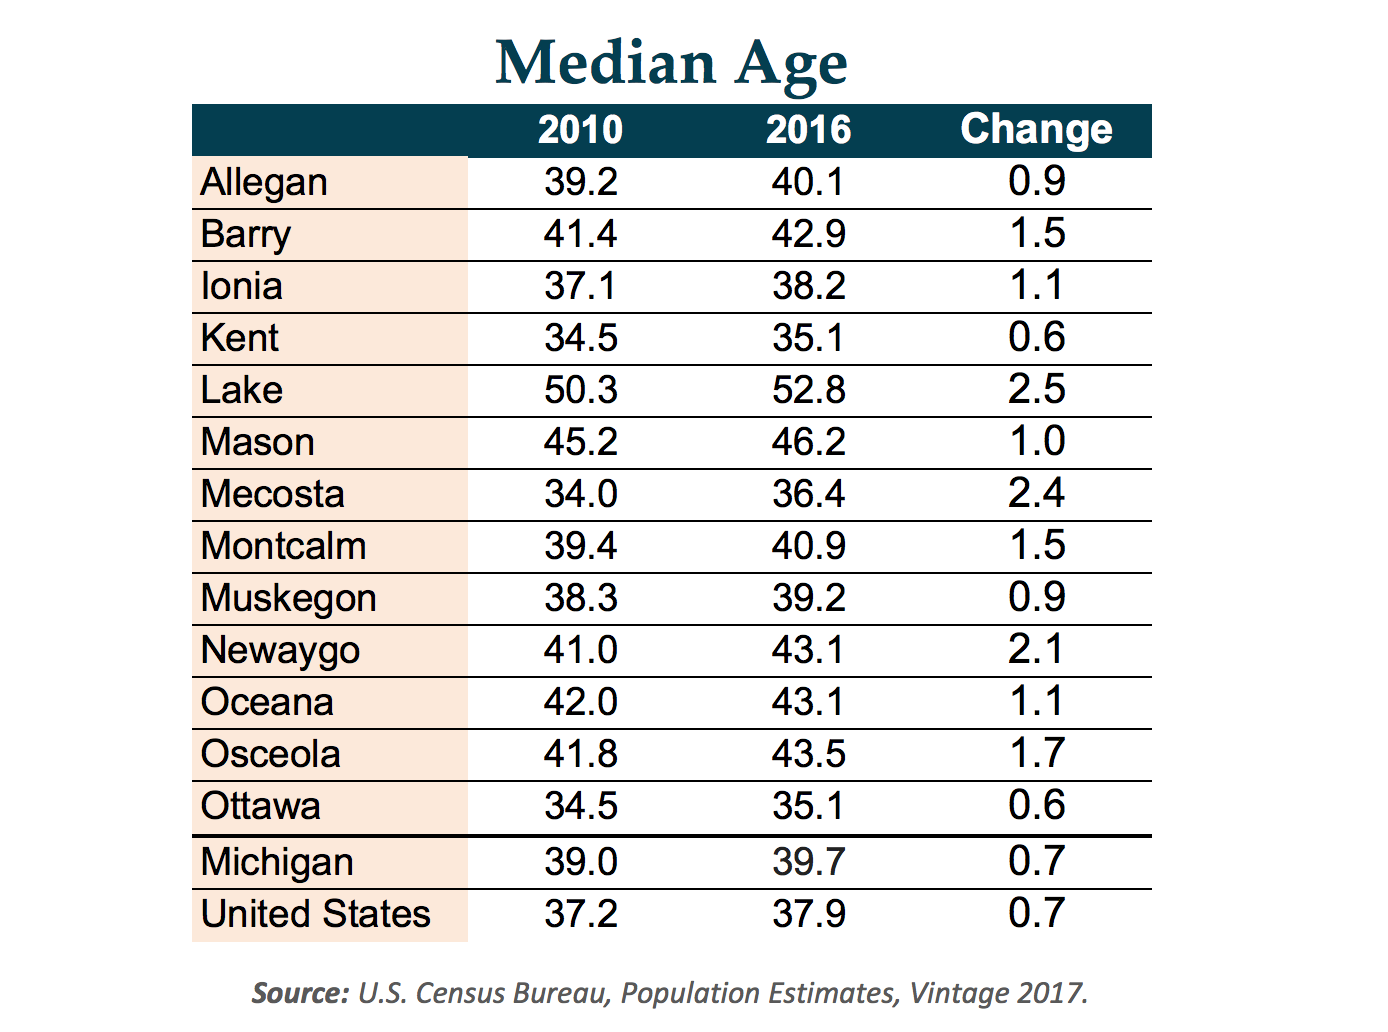
More specifically, Michigan’s median age has slowly inched up from 39.0 in 2010 to 39.7 in 2016. This median age growth of 0.7 matches that seen nationally over the period.
Median age in West Michigan
In West Michigan, the median age for our thirteen counties varies dramatically. Similar to other areas of the country, urban counties tend to have a lower median age, while rural counties tend to skew higher. In 2016, the median age in West Michigan counties varies from a low of 35.1 in Ottawa and Kent Counties to a high of 52.8 in Lake County.

Eight of West Michigan’s 13 counties have a median age higher than the state median of 39.7. Additionally, several counties have seen a dramatic rise in the median age from 2010 to 2016, including Lake (+2.5), Mecosta (+2.4), and Newaygo County (+2.1), each rising more than 2 years during the seven-year span.

Future Data Topics
Have you been enjoying these “Data Points” blogs? Are you interested in other data? Let us know what topics you’d like to know more about on our Twitter @WMTalent2025! We’d like to crunch some numbers that you’re interested in.


