Instructions
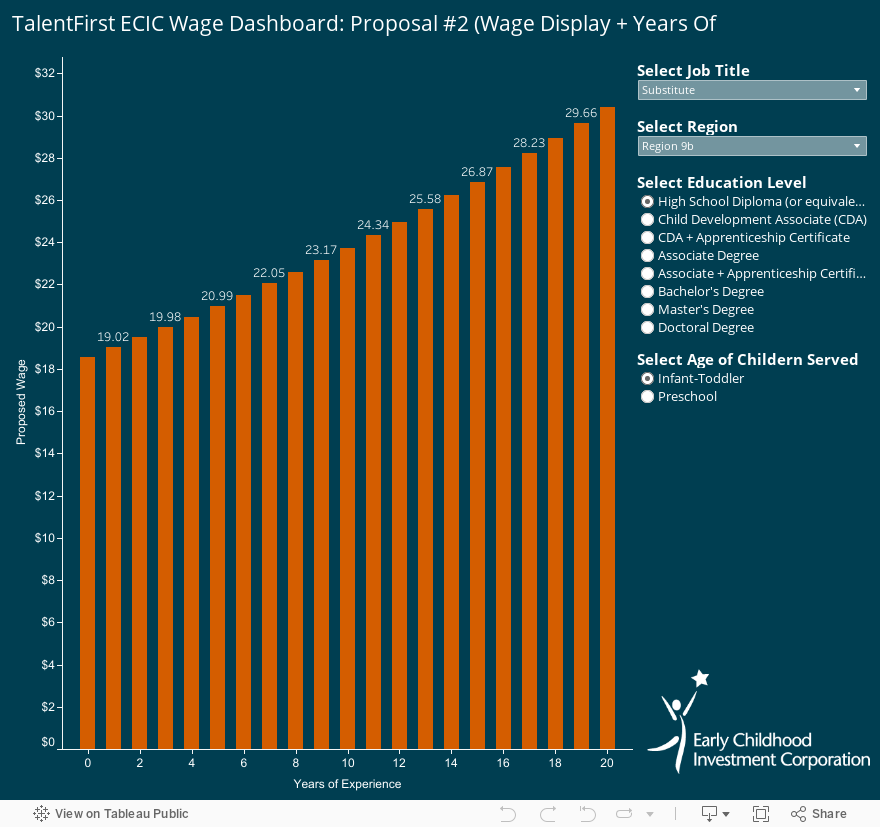
- Select the Job Title: The dashboard will default to show data for Substitutes, but you can use the filter on the right-hand side titled “Select Job Title” to update the chart to the desired job type.
- Select the Region: The dashboard will default to show data for Region 9b, but you can use the filter on the right-hand side titled “Select Region” to update the chart to the desired region. Additionally, The regions are made up of many counties so a necessary graph is included for the sake of locating your county. [refer to the bottom of this tab]
- Select the Education Level: The dashboard will default to show data for High School Diploma, but you can use the filter on the right-hand side titled “Select Education Level” to update the chart to the desired education level.
- Select the Age of Children Served: The dashboard will default to show data for infant-toddler, but you can use the filter on the right-hand side titled “Select Age of Children Served” to update the chart to the desired children served.
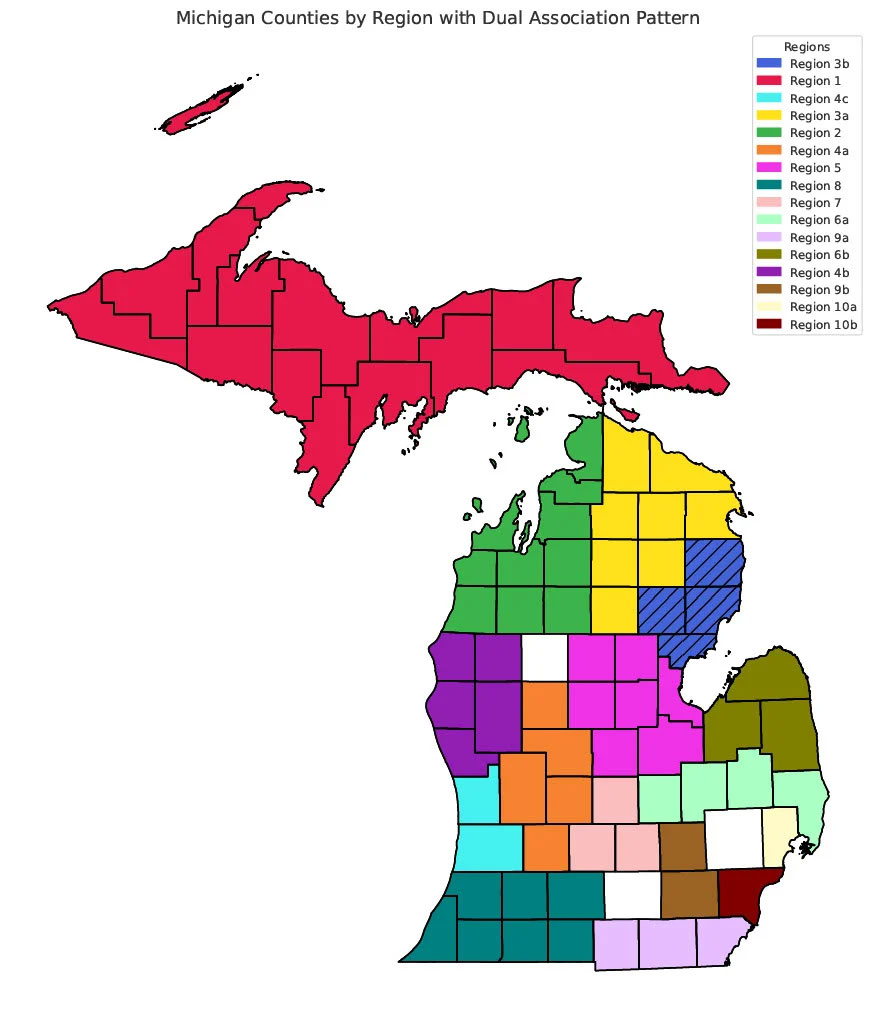
Special Note on Dual-Association Counties and Opted Out Counties:
The counties of Alcona, Arenac, Iosco, and Ogemaw are represented with a checkered pattern, indicating that they are part of two regions. If you reside in any of these counties, you have the option to select one of the two regions your county is associated with.
Here’s the breakdown:
- Alcona: Belongs to Region 3b and Region 3a.
- Arenac: Belongs to Region 5 and Region 3b.
- Iosco: Belongs to Region 3b and Region 3a.
- Ogemaw: Belongs to Region 3b and Region 3a.
The counties of Jackson, Oakland, and Osceola have opted out of the study so this gives reasoning as to why there is no color coding for them in the graph.
How it Works
The proposed wage scale benchmarks ECE wages against comparable K-12 roles by setting the Lead Teacher wage on par with the starting salary of a K-12 teacher in the given geography (adjusted for the standard school schedule), which serves as the base wage for the systemwide wage scale. The base wage for an Assistant Teacher and Substitute stands 25% below the base wage of a Lead Teacher, while the base wage for an Aide/Floater is 50% less than a Lead Teacher. This scaling reflects the accumulation of responsibility, knowledge, and experience that occurs as one transgresses along the ECE career pathway from Aide to Lead Teacher.
The systemwide wage scale is agnostic to setting (school-based, center-based, family or group childcare home). Thus, wages are based on the specific role, professional level/education, and experience an individual has — irrespective of the setting in which they are employed. The base wages shown below increase by 10% for each professional/educational level an individual has obtained above a Child Development Associate (CDA) credential. This method encourages progression, which is strongly linked to quality, and helps account for the fact that licensing requirements vary across settings for these ECE roles.
ECE professionals supervising infant- and toddler-aged children will receive a 10% increase from the base wage associated with that role supervising preschool-aged children. This wage bump reflects the intense level of supervision required for infants and toddlers compared to preschoolers, a notion which is further reinforced by the provider-to-child ratios set by the state — which become less restrictive as children age.
To account for longevity, early educators should receive a 2.5% increase for each year of employment. This reflects the average step increase offered to K-12 educators and is equal to the average rate of inflation forecasted in the state over the next 10 years — ensuring wages rise at a rate equal to the cost of living.
Additional Information
If you would like to delve deeper into the comprehensive study and explore more quantitative data, view the interactive report for your region. This resource provides access to an extended analysis, allowing you to access a wealth of additional information and detailed numerical insights.