How We Can All Address Chronic Absenteeism to Support Student Success
The Attendance Imperative: Attending school regularly is essential for students to gain the academic, social and emotional skills they need to thrive. Chronic absence — when a student misses 10% or more of the school year, or about 18 days per year or 2-3 days per month — has real-life consequences for students, families and society. Research shows that, starting as early as preschool and kindergarten, chronic absence can leave third graders unable to read proficiently, sixth graders struggling with coursework and high school students off track for graduation.
Chronic absenteeism — which includes all types of absences, such as excused, unexcused, and suspensions — remains a serious problem in Michigan and is a major contributor to the state’s early literacy crisis. In TalentFirst’s ongoing work with West Michigan educators to develop strategies to improve third-grade reading levels, we consistently heard that when kids miss class, reading instruction suffers.
This dashboard can give an overview of attendance rates for all public K-12 students in Michigan or compare rates for different locations, grade levels or demographics and the impact it has on their 3rd grade reading performance.
How it Works
The dashboard draws on statewide data from Michigan’s Center for Educational Performance and Information (CEPI), including 3rd Grade State Testing and Chronic Absenteeism reports. It is an interactive tool allowing users to compare building-level reading performance on the third grade M-STEP (Michigan’s statewide assessment of grade-level literacy) in relation to the share of students considered chronically absent. Attendance rates are calculated for a school or district by dividing aggregated total days attended by aggregated total possible attendance.
Instructions
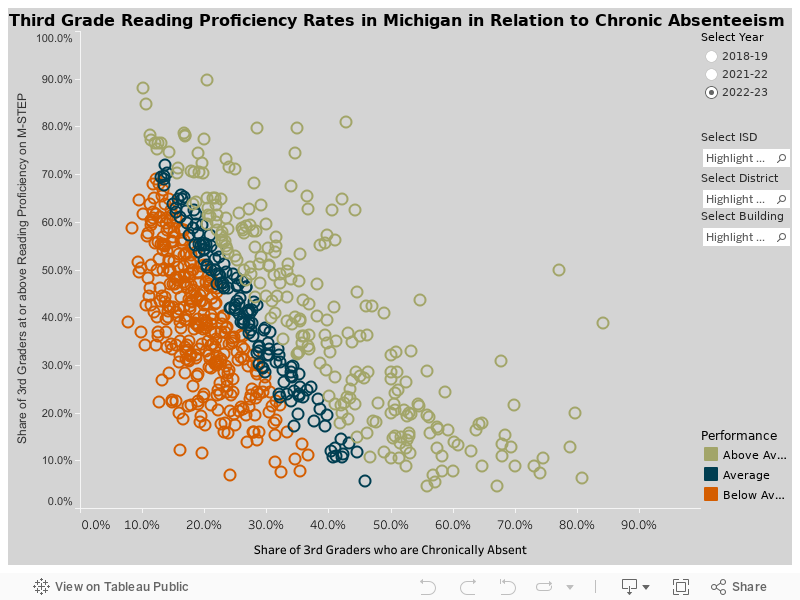
- Select the year: The dashboard will default to show data from 2018-19, but you can use the filter on the right-hand side titled “select year” to update the chart.
- Choose a school by ISD, district, or individual building – you can scroll through the list or type in the search bar to find your school.
- Click the ‘x’ next to each search bar to clear results and initiate another search.
- Hover over any circle on the chart to see more detailed information.
Interpreting Results
The chart depicts building-level reading performance on the 3rd grade M-STEP assessment in relation to the share of students considered chronically absent. Buildings shaded green perform better than we would expect given their proportion of chronically absent students, buildings shaded blue perform within expectations, while those shaded orange perform worse than expected.
Click here for Screenshots on how to view and interpret the results (PDF)
- Schools can be compared vertically with similar economic status to highlight schools that are significantly outperforming their peers.
- Additionally, schools can be compared horizontally with similar reading proficiency levels to highlight schools that are beating the odds based on their chronic absenteeism rates.
Note: some buildings were suppressed in the original data in compliance with FERPA and the more robust disclosure avoidance rules enacted by CEPI and the Michigan Department of Education.