One week ago, the U.S. Census Bureau released new 2016 data within their American Community Survey (ACS) program, which is one of the most extensive federal data projects that releases data every year. The ACS dataset encompasses variables from economic and population categories to social and household indicators. In short: this data is probably the most valuable public source of data Talent 2025 uses.
While 5-year estimates (aggregates of the past five years) will be available in December for every size of geography, the 1-year estimates released last week are available for areas with populations over 65,000. In West Michigan, that includes 4 counties (in order of population): Kent, Ottawa, Muskegon, and Allegan Counties. We look forward to getting data for the whole region in December, but for now we want to look at two indicators for these four counties: educational attainment, and labor force participation.
Educational Attainment
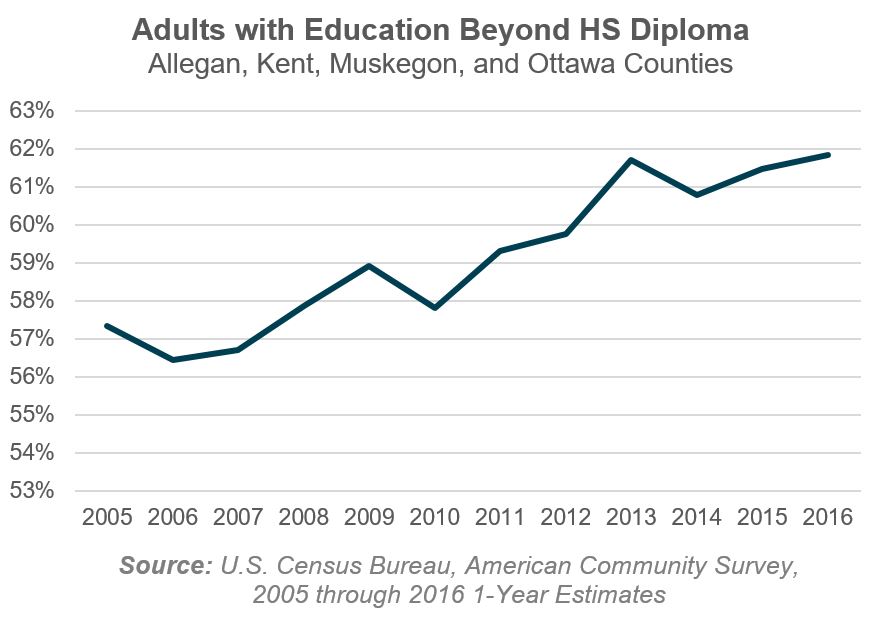
The proportion of the adult population with education beyond a high school diploma or equivalent is part of the overarching goal of Talent 2025 (see Goal 2025), and as a region we project that 64 percent of jobs in 2025 will require this level of education.
With this release, we can take a look at the educational attainment for residents of the four largest counties in West Michigan.
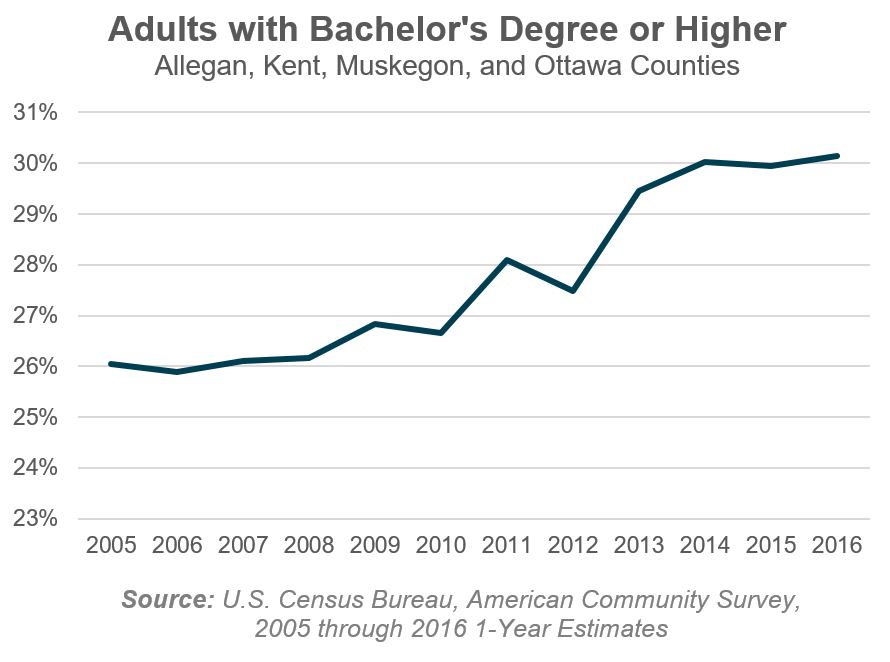
From 2015 to 2016, the percent of adults with education beyond a high school diploma or equivalent rose slightly, from 61.5 percent to 61.8 percent, or 0.3 percentage points. This is a slower increase than the year before. Part of this was due to the percentage of residents with a Bachelor’s degree or higher, which has largely flattened out over the past two year. In these four counties, the percent of adults with at least a four-year degree was 30.0 percent in 2014 and 2015, and stayed largely the same at 30.1 percent in 2016.
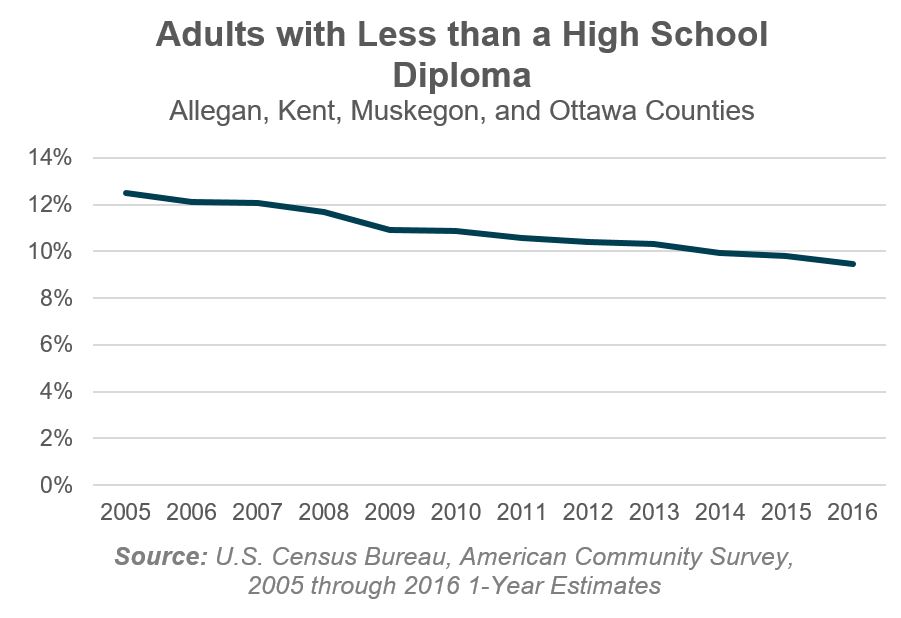
An encouraging trend, however, showed up in the percentage of adults with less than a high school diploma. In these four counties, this metric has been decreasing by about 0.3 percentage points each year since 2005. This metric dropped by about that much from 2015 to 2016 to a new level of 9.5 percent.
Labor Force Participation
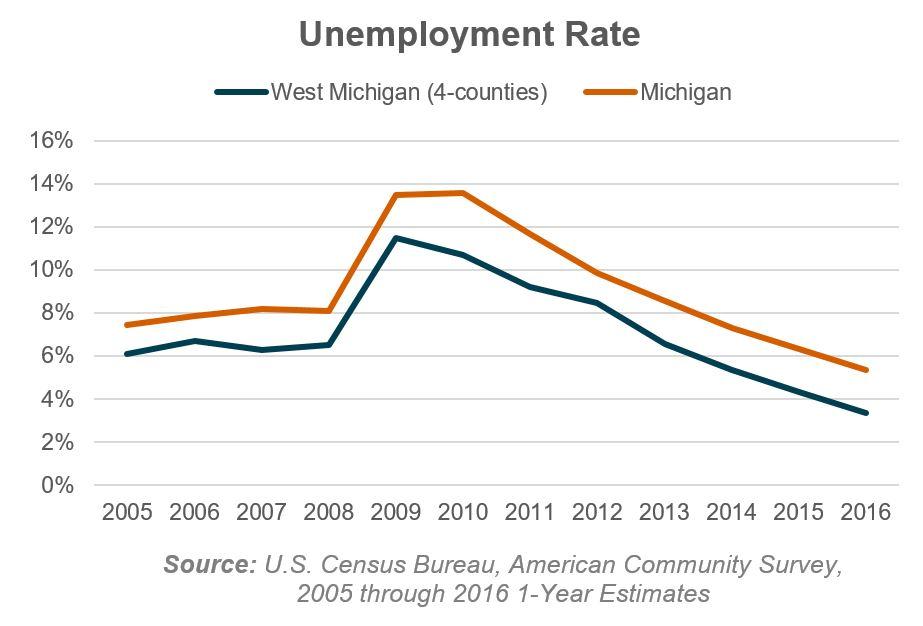
One of the indicators used in our Workforce Development Working Group (and further explored in our comparative report from Public Sector Consultants) is the working-age labor force participation rate, which counts the proportion of the working age (ages 25-54) population who are either employed or are actively looking for work. As the unemployment rate continues to fall (see figure below), employers are looking far and wide for qualified talent.
The working-age labor force participation rate in West Michigan’s largest four counties dropped slightly from 2015 to 2016, and currently sits at 83.4 percent. However, after an equally small increase in the previous year, this indicator has remained relatively unchanged since 2011.
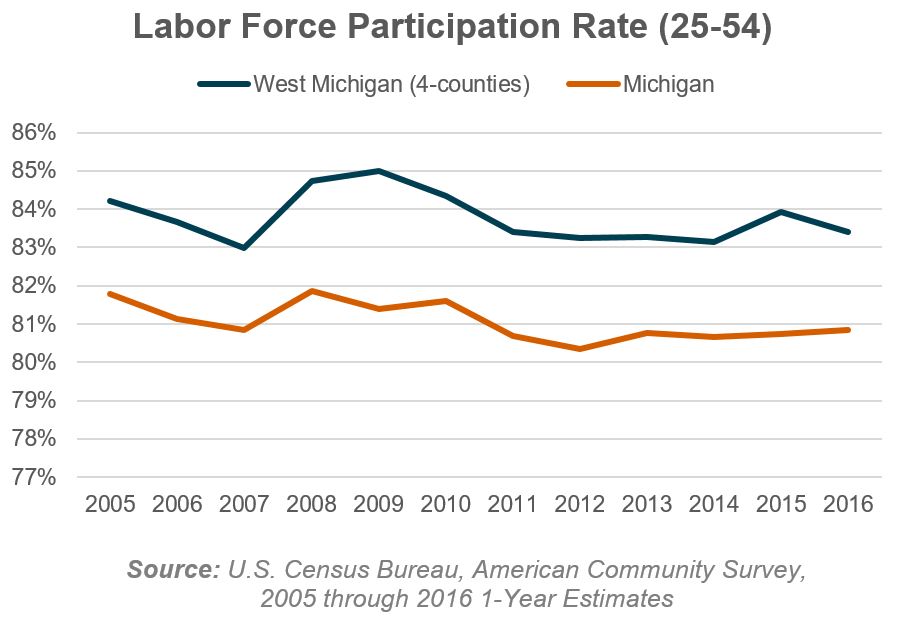
This local participation rate was 2.6 percent higher than the state of Michigan in 2016, maintaining the trend of being two-and-a-half to three percentage points higher than the state over the past 12 years.
Data for the Entire West Michigan Region
The U.S. Census Bureau will release 2012-2016 5-year estimates for all geographic areas in early December, at which point we will revisit a few of these key topic areas for the 13-county region. Talent 2025 will also be updating the ACS-derived variables on our dashboard.
Want to learn more about how Talent 2025 uses U.S. Census Bureau data? Check out this blog post from August.


