A recent article by Amy Liu of the Metropolitan Policy Program at Brookings Institute spoke to the importance of data in the wake of a natural disaster. In reference to the recent string of hurricanes to hit the Caribbean and the southern United States, Liu makes the case for the utilization of “democratic and inclusive” data in recovery efforts. She cites the collaboration between Brookings and the New Orleans Data Center after Hurricane Katrina as a prime example.
One of the data sources most helpful after a natural disaster is the U.S. Census Bureau’s OnTheMap tool. Connecting unemployment insurance wage record data, which has information on employees and jobs through employers, as well as other Census Bureau data on age, earnings, and industry. This makes for a powerful interactive tool which can be found here. We’ll first take a look at how it can be utilized in a disaster, as referenced above, and then see how Talent 2025 has used this data in mapping the regional labor shed.
Mapping natural disasters
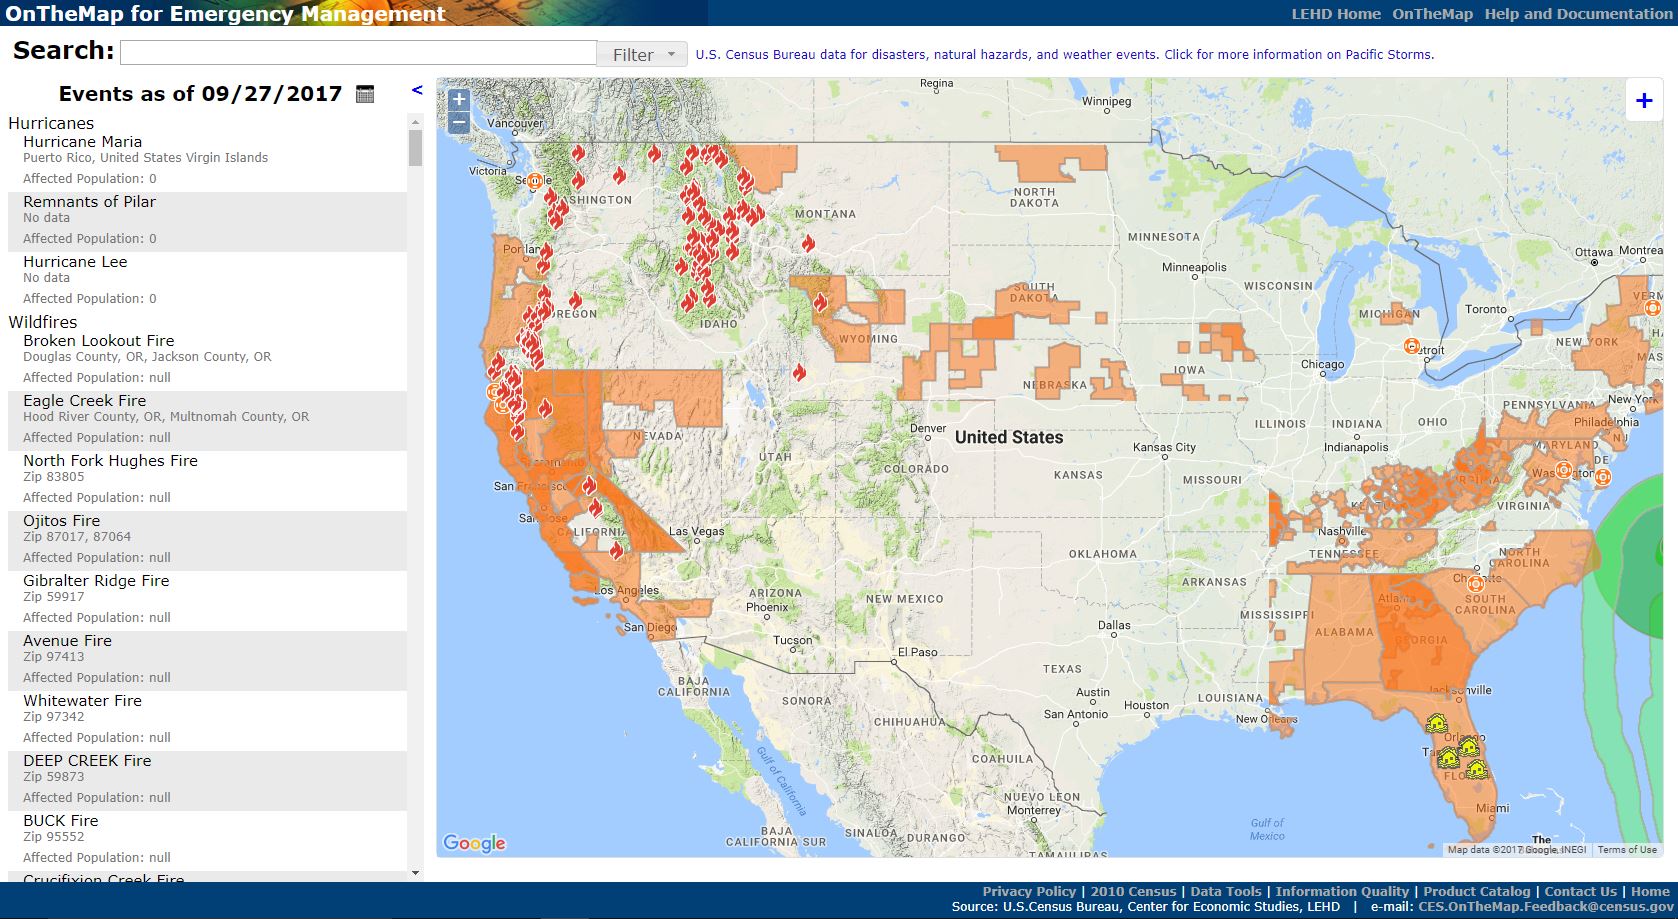
Because all the data in the OnTheMap tool is geographically based, the power of this dataset comes from how you can analyze it. The U.S. Census Bureau makes this easier by having a specific version of the tool: OnTheMap for Emergency Management. These data have been used by first responders, government officials, nonprofits, and even journalists and news organizations. As you can see in the screenshot below, natural disasters are geographically plotted as they happen so that one can easily overlay the path of a storm, fire, or other natural disaster, onto the population and employment data.
Within OnTheMap, you can customize the area you’re searching for. As a very general example, if we wanted to see how many people work within a quarter-mile of the Grand River in Kent County (perhaps in the case of a flood), we simply trace the river with the selection tool, and perform the analysis on those who work in the selected area. First the tracing:
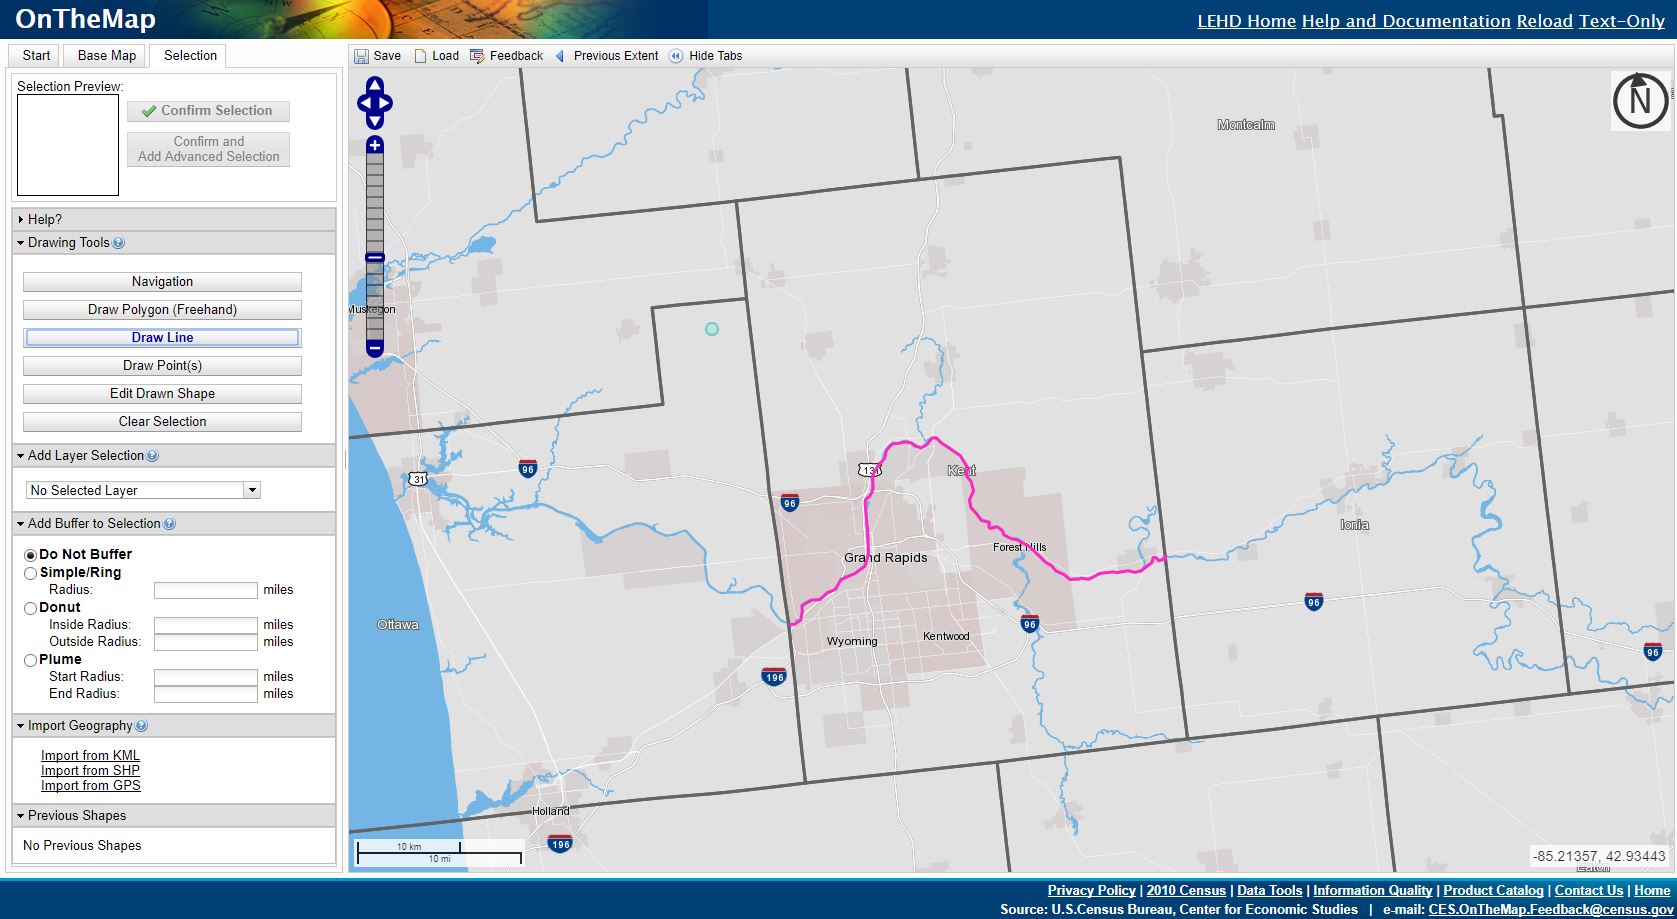
And then the results after a buffer:

As you can see, there are over 24,000 individuals who work within a quarter-mile of the Grand River in Kent County, with over half of them making over $3,333 per month. Scrolling down on the right panel, we can learn what industries would be most affected, the race, ethnicity, and educational attainment of the workers, as well as other relevant details.
How Talent 2025 uses OnTheMap data
Although the examples above show the data-rich analyses that can be performed using OnTheMap, we primarily use this tool to look at commuting patterns (primarily in our annual Talent Assessment and Outlook report). Because the LODES (LEHD Origin-Destination Employment Statistics) data connects where workers live with their destinations for work (their employer), we can see where people travel within a region.
The table below was in the 2017 Talent Assessment and Outlook, and shows county-to-county commuting within the West Michigan region (note: data are from 2014).
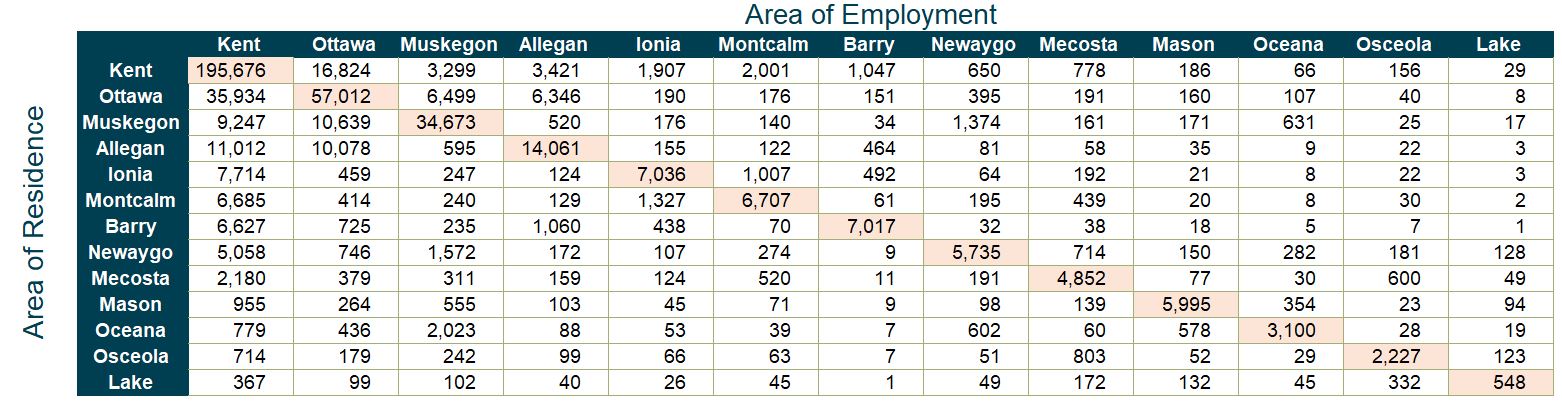
Data such as these are helpful in establishing the definition of what a local labor shed looks like. Talent is mobile, and when employers are looking for job candidates who are already local, it can be important to realize that commuting between counties is normal. As an example, in 2014, over 50,000 individuals traveled between Kent and Ottawa Counties for their employment.
New data is here!
If OnTheMap has had one drawback, it’s that up until recently, we were still working with 2014 data. However, as of last week, data for 2015 has been loaded into the OnTheMap interface. Check it out here.