Last month, the U.S. Bureau of Labor Statistics released their national employment projections for the 2016-2026 period. These projections are done every two years, and give us a great opportunity to peek into the future of the national labor market, and where we should expect higher-than-average occupational growth.
Occupational categories with expected growth
The economy is divided into 22 distinct occupational categories, and while all but one of them are expected to grow nationally through 2026, not all of them are equal.
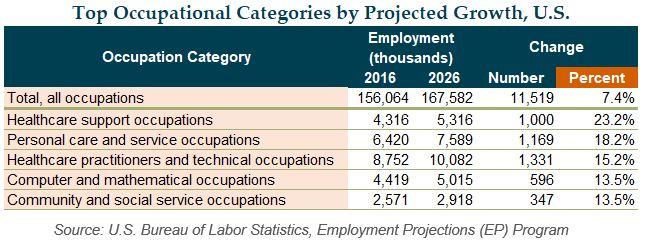
Across the economy, employment growth is projected to be 7.4 percent through 2026, an addition of over 11.5 million jobs. Thirteen occupational categories best this average, including Healthcare support occupations (growing by 23.2 percent), Personal care and service occupations (18.2 percent), Healthcare practitioners and technical occupations (15.2 percent), and Computer and mathematical occupations and Community and social service occupations (both at 13.5 percent). Many of these are also near the top in terms of numeric job growth through 2026, which also includes Food preparation and serving related occupations, which is expected to add over 1.2 million jobs.

Nationally, Production occupations are the only occupational group expected to decline (by 4.1 percentage points) while Farming, fishing, and forestry occupations is projected to stay relatively flat through 2026. Of course, it’s important to note that employment change will be different within smaller geographical areas: in West Michigan, our most updated projections (through 2024) show Production occupations still growing at a steady 7.5 percent.
Specific occupations with rapid growth
Looking specifically at individual occupations, the top 10 expected to grow the fastest are perhaps emblematic of where the economy is expected to go in the long run, including trends in alternative energy as well as the aging of the American population. The top two occupations, Solar photovoltaic installers and Wind turbine service technicians, are admittedly small but are both projected to about double in size through 2026. After that, five of the top ten occupations are healthcare related, led by Home health aides, which is projected to grow by 46.7 percent. Finally, three technical occupations round out the top ten, including Statisticians (33.4 percent), Software developers, applications (30.5 percent) and Mathematicians (29.4 percent).
The occupations expecting the highest numeric growth (which tend to already be larger occupations) include Personal care aides (adding 754,000 jobs through 2026), Combined food preparation and serving workers, including fast food (+579,900 jobs), Registered nurses (+437,000 jobs), Home health aides (+425,600 jobs), and Software developers, applications (+253,400 jobs).
Opportunities at many levels of education
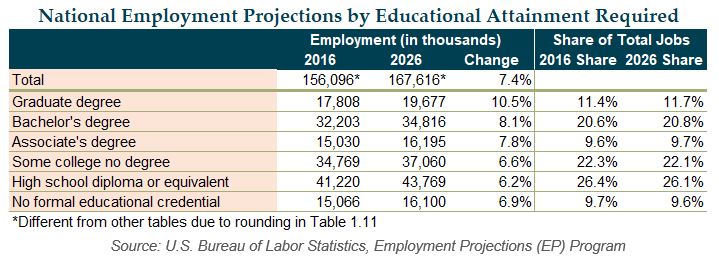
An important way to use projections data like this is to look at the education and credentials needed in this future workforce. In crossing this recently released employment projections data with the Bureau of Labor Statistics educational tables (specifically, E-P 1.11), we can estimate what level of education will be most in demand in 2026.
In 2026, we estimate that 64.3 percent of jobs nationally will require some level of education beyond a high school diploma. This is up from the 2016 level of 63.9 percent, primarily from growth in jobs requiring a graduate degree, a Bachelor’s degree, and an Associate’s degree.

Technical Note
Projections data are available on the industry and occupation level, although this post focuses on the occupational side. Industries represent the classification of the employer, whereas occupations are defined for individual employees.
Education required for future occupations was determined by modeling national proportions from the U.S. Bureau of Labor Statistics Table 1.11 onto future employment numbers. Talent 2025 uses this table for analysis because it gives a more granular picture of education needed for employment in occupations than Table 1.12, which classifies each occupation under one education level.


