Each year, the U.S. Census Bureau releases several datasets that originate from the American Community Survey. While individuals often think of “the census” as the count of American citizens every ten years, there’s actually much more to it. The American Community Survey continually collects lots of social and economic information about everyone who lives in the U.S. (whether they are citizens or not) and then annually releases estimates about many levels of geography.
For large areas such as states, cities, and counties over 65,000 in population, 1-year estimates are released annually in mid-fall. Then, in December, 5-year estimates (which average survey responses over the fixed 5-year period) are released for all levels of geography no matter the population size. This allows organizations and localities to analyze information about areas down to the ZIP code, Census tract, and even block group level.
Because Talent 2025 is composed of 13 counties (9 of which are below 65,000 in population), we use 5-year estimates to analyze our region as a whole. With the release of the 2012-2016 estimates, we can now look at a few key indicators about our region.
Educational Attainment
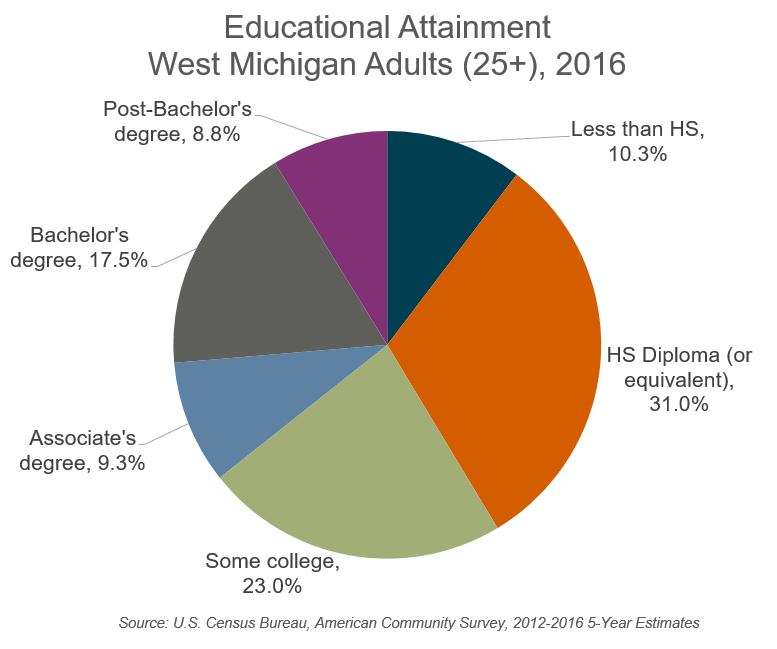
Behind all of the work of Talent 2025 sits Goal 2025, which is our regional vision to have 64 percent of adults in West Michigan with education beyond a high school diploma.
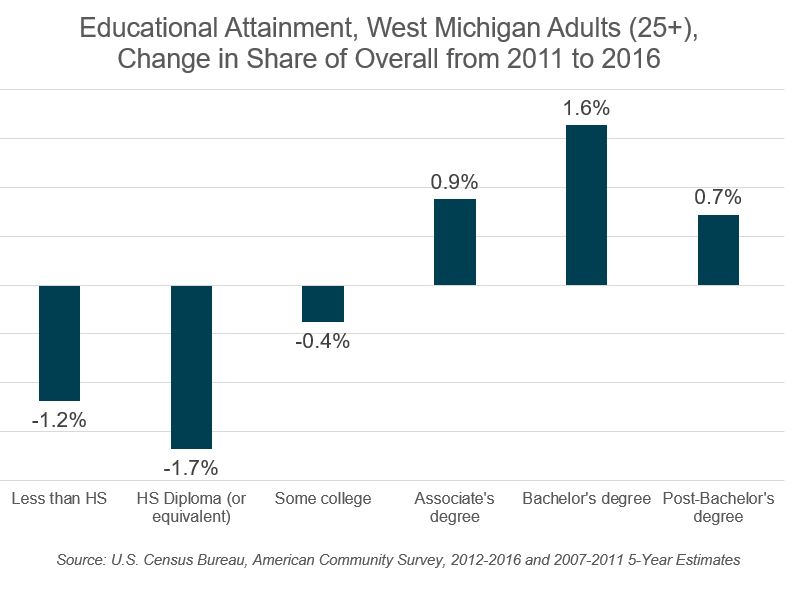
New ACS data shows that we continue to make gains towards this goal. In 2016, 58.6 percent of adults in West Michigan have education beyond a high school diploma, with 26.3 percent of the population holding a Bachelor’s degree or above. Additionally, only 10.3 percent of adults in the region have less than a high school diploma or equivalent, which is 1.2 percentage points lower than in 2011. We are moving in the right direction.
Labor Force Participation Rate
Another indicator which is among the first that we analyze when new data is available is the labor force participation rate for working-age adults (25-54). You can read more about why we use this statistic here on one of our past blog posts.
As with the rest of the country, West Michigan sees the labor force participation rate struggling since the turn of the century, and that trend continues in the new data. Overall, 82.0 percent of working-age adults in our region are working or looking for work. This is a full percentage point lower than was seen in 2011, with over 4,000 more individuals being “not in the labor force” in 2016 than in 2011.
Nationally, West Michigan would rank about 72nd in this indicator compared to Combined Statistical Areas across the country, and is about 3.5 percentage points behind being a top-20 region. If West Michigan’s working-age labor force participation rate could bridge this gap, that would translate into over 21,000 more workers.
Commuting to Work
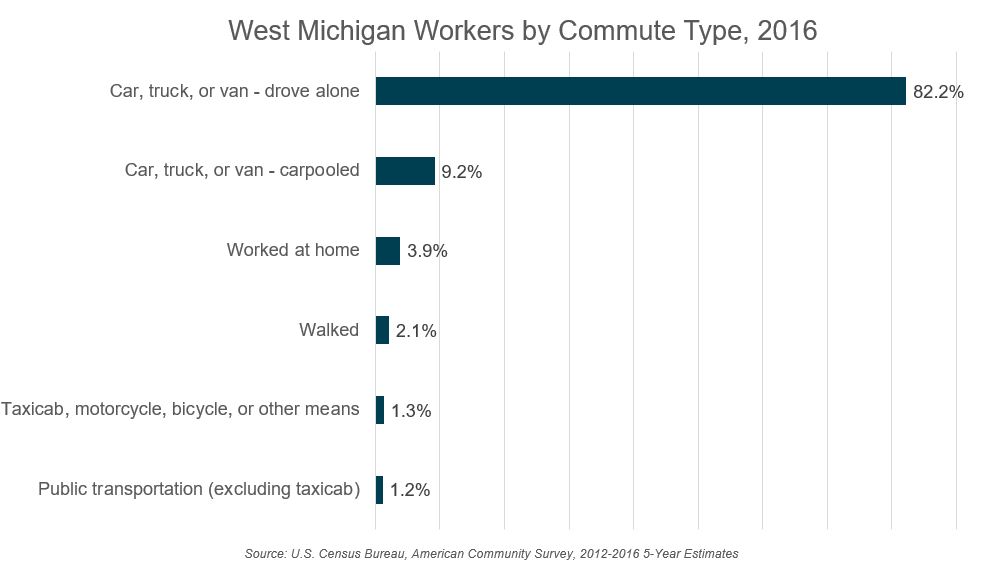
In order to illustrate the wealth of indicators available in the American Community Survey, we picked commuting to work as our final topic for this blog. By age group, we can view the method of transportation individuals utilized to get to work every day in our region, from driving alone and carpooling to public transportation, biking, and walking.
Unsurprisingly, the vast majority of workers in West Michigan drove themselves to work, with 82.2 percent of workers 16 and older commuting in a car by themselves. Additionally, 9.2 percent of workers carpooled to work, meaning that over 9 out of every 10 workers commuted in a car. These proportions are largely unchanged over a five year period.
Future Data Topics
Have you been enjoying these “Data Points” blogs? Are you interested in other data as well? Let us know what topics you’d like to know more about on our Twitter @WMTalent2025! We’d like to crunch some numbers that you’re interested in!