Whenever you hear a workforce, education, or economic statistic, there is always an important characteristic attached that is often glossed over: the geography. However, the area of analysis can be very important to how the data can and should be used. Call this an “eat your vegetables” edition of Data Points, but geography is incredibly important in economic analysis.
Why do I need to know about statistical areas?
Depending on the type of work you do, knowing what areas you work with matters. In our work at Talent 2025, we refer to West Michigan as the 13-county region that aligns with the State of Michigan’s Prosperity Region Initiative. We also use this area because it forms a unique labor shed; talent will often commute or relocate within the region. Importantly, we define this area using a summation of counties because this allows us to use 5-year estimates of American Community Survey data to get any indicator available within that survey.
For some, the labor shed needs to be more tightly defined. When carrying out a study on, say, affordable childcare, using areas too large (such as MSAs) can mask “childcare deserts,” or areas that do not have adequate access to services. Commuter sheds and public transportation mapping can help uncover these sub-county areas.
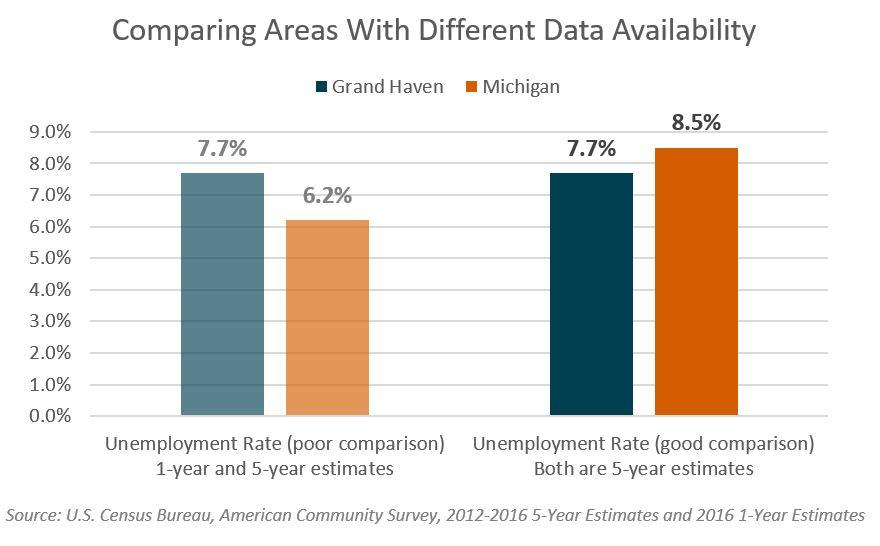
Additionally, it’s important to know about how to compare (and how not to compare) statistics about different areas. If working with a small geographical area (e.g. the City of Grand Haven), it may be required to use 5-year estimates from the ACS, which averages survey results from a 5-year period (right now, 2012 to 2016).
When comparing unemployment data within the city with the statewide level, it’s easy to accidentally select the 1-year estimate that is available for larger areas (this would include unemployment data for just 2016). Since unemployment has generally been decreasing since the end of the recession, the City value could appear higher because of the extended time range (to the left), leading to false conclusions.

The U.S. Census Bureau has a slew of technical notes and comparability documents to help aid in this process of the analysis.
Areas in West Michigan
Within West Michigan, we have two Metropolitan Statistical Areas: the Grand Rapids-Wyoming MSA (which includes Kent, Ottawa, Montcalm, and Barry counties) and the Muskegon MSA (which includes Muskegon County). At a broader geography level, these two MSAs are combined with each other and with Allegan, Ionia, and Mecosta counties to create the Grand Rapids-Wyoming-Muskegon Combined Statistical Area (CSA), an 8-county region that accounts for over 91 percent of the 13-county region we refer to as West Michigan. The three counties added into the CSA are each considered micropolitan statistical areas.
On a sub-county basis, Cities and Places are among the most utilized statistical areas. These are the administrative boundaries we hear about more often that not, including the Cities of Grand Rapids, Muskegon, and Holland, with many of the suburbs being separate places: the City of Wyoming, the City of Muskegon Heights, etc.
Future Data Topics
Have you been enjoying these “Data Points” blogs and are interested in other data? Let us know what topics you’d like to know more about on our Twitter @WMTalent2025! We’d like to crunch some numbers that you’re interested in!


