In an effort to better track progress over time, Talent 2025 selected six key performance indicators to measure the economic conditions of West Michigan against those of 11 identified peer communities. This composes our 2018 Comparative Dashboard, which illustrates how West Michigan ranked amongst its peer communities in 2017 — for each labor market indicator — and how those rankings have improved since 2015. Although today’s post will only cover a few indicators, the 2018 Comparative Dashboard is currently available on our website. This also includes West Michigan’s national ranking for each indicator, as well as the corresponding change from the national ranking recorded in 2015.
American Community Survey (ACS) 1-year Estimates from 2015 were ranked for each Combined Statistical Area (CSA) across the nation — for each of our six labor market indicators — yielding both a national ranking and a peer ranking for West Michigan as compared to the nation and its peer communities, respectively. These 2015 rankings were then compared to those recorded in 2017, allowing us to track progress in West Michigan against the nation and our peers, across six indicators of a flourishing economy. Using the list of peer communities that were identified in the 6th edition of our West Michigan Talent Assessment and Outlook report allows us to better understand and benchmark our region in comparison to similar areas throughout the country.
Each peer CSA is comparable to the 13-county West Michigan region both in terms of population and industry makeup, as these areas have populations within 30 percent of the Grand Rapids-Wyoming-Muskegon, MI CSA, as well as over 10 percent of employment in Manufacturing. These 11 peer CSAs are:
- Birmingham-Hoover-Talladega, AL CSA
- Buffalo-Cheektowaga, NY CSA
- Dayton-Springfield-Sidney, OH CSA
- Greensboro-Winston-Salem-High Point, NC CSA
- Greenville-Spartanburg-Anderson, SC CSA
- Harrisburg-York-Lebanon, PA CSA
- Hartford-West Hartford, CT CSA
- Knoxville-Morristown-Sevierville, TN CSA
- Louisville/Jefferson County-Elizabethtown-Madison, KY-IN CSA
- Rochester-Batavia-Seneca Falls, NY CSA
- Tulsa-Muskogee-Bartlesville, OK CSA
Educational Attainment
Behind all of the work of Talent 2025 lies Goal 2025, which is our regional vision to have 64 percent of adults in West Michigan possess some form of education beyond a high school diploma.
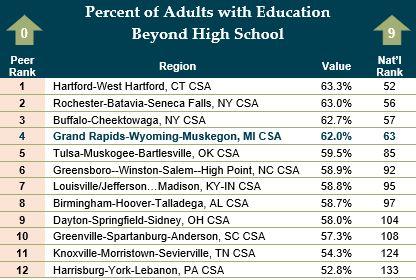
New ACS data illustrates that the region continues to make progress toward our goal. In 2017, 62.0 percent of adults in the Grand Rapids-Wyoming-Muskegon, MI CSA possessed some education beyond a high school diploma, ranking 4th amongst our peers and 63rd nationally. Although our peer ranking hasn’t changed since 2015, West Michigan’s national ranking increase of 9 spots over this two-year period reflects a regional growth of 2.2 percent for this indicator.
Labor Force Participation Rate (16+)
As with the rest of the country, West Michigan has experienced a slow recovery since the turn of the century with respect to the labor force participation rate of those aged 16 and over. However, it would appear that progress in West Michigan is outpacing both our peer communities and CSAs across the nation. Overall, 65.9 percent of adults aged 16 and over in our region were either employed or looking for work in 2017, an increase of 0.7 percent from the rate observed in 2015. While it may appear that our progress is stagnating, this translated to a growth of 7 rankings, nationally, and 2 rankings amongst our peers — bringing West Michigan to the top spot for this indicator, when compared to our peers.
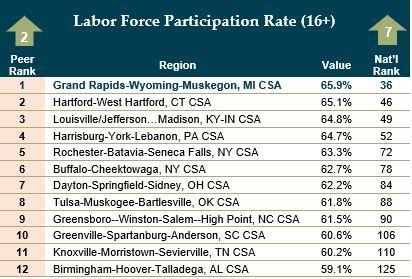
Nationally, West Michigan would rank 36th for this indicator when compared to 175 Combined Statistical Areas across the country — lagging a top-20 ranking by nearly 2 percentage points. If West Michigan’s labor force participation rate could bridge this gap, over 11,000 additional workers would enter the labor force.
Future Data Topics
Have you been enjoying these “Data Points” blogs and are interested in other data? Let us know what topics you’d like to know more about on our Twitter @WMTalent2025! We’d like to crunch some numbers that you’re interested in!