In an effort to better track progress over time, Talent 2025
selected six key performance indicators to measure the economic conditions of West
Michigan against those of 11 identified peer communities. This composes our 2018
Comparative Dashboard, which illustrates how West Michigan ranked amongst its
peer communities in 2017 — for each labor market indicator — and how those
rankings have improved since 2015. The comprehensive 2018
Comparative Dashboard is currently available on our website.
American Community Survey (ACS) 1-year Estimates from 2015 were
ranked for each Combined Statistical Area (CSA) across the nation — for each of
our six labor market indicators — yielding both a national ranking and a peer
ranking for West Michigan as compared to the nation and its peer communities,
respectively. These 2015 rankings were then compared to those recorded in 2017,
allowing us to track progress in West Michigan against the nation and our peers,
across six indicators of a flourishing economy. Using the list of peer
communities that were identified in the 6th edition of our West
Michigan Talent Assessment and Outlook report allows us to better
understand and benchmark our region in comparison to similar areas throughout
the country. Each peer CSA is comparable to the 13-county West Michigan region
both in terms of population and industry makeup, as these areas have
populations within 30 percent of the Grand Rapids-Wyoming-Muskegon, MI CSA, as
well as over 10 percent of employment in Manufacturing. These 11 peer CSAs are:
- Birmingham-Hoover-Talladega, AL CSA
- Buffalo-Cheektowaga, NY CSA
- Dayton-Springfield-Sidney, OH CSA
- Greensboro-Winston-Salem-High Point, NC CSA
- Greenville-Spartanburg-Anderson, SC CSA
- Harrisburg-York-Lebanon, PA CSA
- Hartford-West Hartford, CT CSA
- Knoxville-Morristown-Sevierville, TN CSA
- Louisville/Jefferson County-Elizabethtown-Madison, KY-IN CSA
- Rochester-Batavia-Seneca Falls, NY CSA
- Tulsa-Muskogee-Bartlesville, OK CSA
Labor Force Participation Rate (16+)
As with the rest of the country, West Michigan has
experienced a slow recovery since the turn of the century with respect to the
labor force participation rate of those aged 16 and over. However, it would
appear that progress in West Michigan over the past five years has outpaced
both our peer communities and CSAs across the nation.
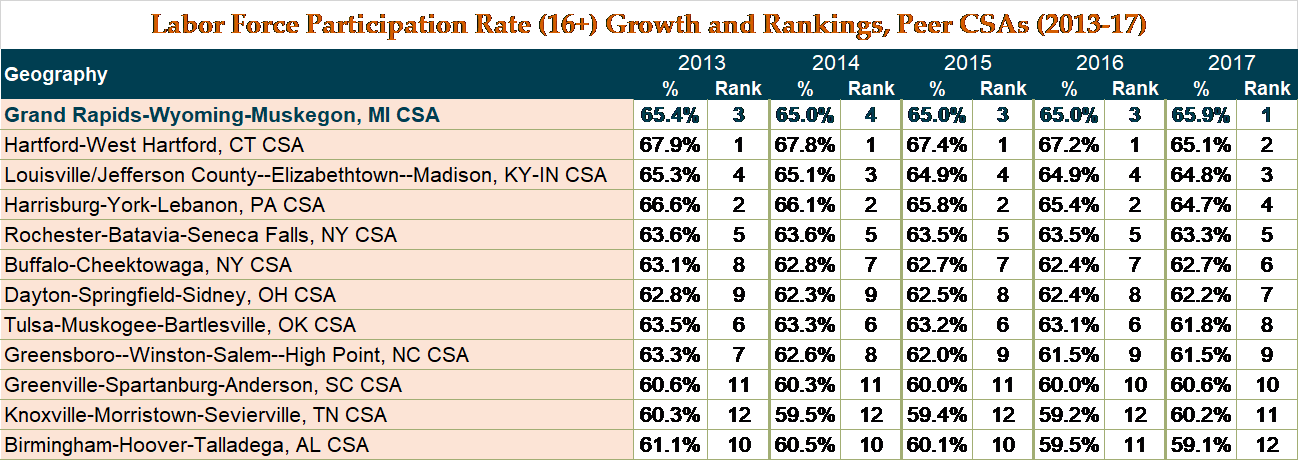
Overall, 65.4 percent of adults aged 16 and over in our
region were either employed or looking for work in 2013. Comparatively, only
the peer CSAs of Hartford-West Hartford, CT (67.9%) and
Harrisburg-York-Lebanon, PA (66.6%) reported a higher labor force participation
rate than West Michigan at this time. Despite a slight decrease of 0.4 percent
to this metric recorded two years later, at 65.0 percent in 2015, our region’s
ranking amongst its peer communities remained unchanged. Although our peers in
Connecticut and Pennsylvania also experienced similar losses to their labor
force participation rates in 2015 — at 0.5% and 0.8%, respectively — West
Michigan still trailed the top spot by nearly 2.4 percentage points.
Then, in 2016, the situation began to change. West Michigan’s
labor force participation rate (65.0%) still ranked third among our eleven
identified peer communities, but our top peers in Connecticut (67.2%) and Pennsylvania
(65.4%) were experiencing losses to their labor force participation rates — while
participation in the West Michigan workforce remained unaffected. Indeed, only
three other comparative CSAs included in our Dashboard joined West Michigan to
experience no change to this metric over the period from 2015 to 2016.
Now, in 2017, West Michigan’s labor force participation rate
takes the top spot amongst our peers. With an over-the-year increase of 0.5
percentage points — bringing the regional rate to 65.9 percent — West Michigan
was the only community, relative to our peers, to experience growth in labor
force participation over this period. Furthermore, the previously leading CSAs of
Hartford-West Hartford, CT and Harrisburg-York-Lebanon, PA experienced the
greatest losses to their labor force participation rates over this period, at -2.8%
and -1.9%, respectively.
Future Data Topics
Have you been enjoying these “Data Points” blogs and are
interested in other data? Let us know what topics you’d like to know more about
on our Twitter @WMTalent2025! We’d like to crunch some numbers that you’re
interested in!