In an effort to better track progress over time, Talent 2025
selected six key performance indicators to measure the economic conditions of West
Michigan against those of 11 identified peer communities. This composes our 2018
Comparative Dashboard, which illustrates how West Michigan ranked amongst its
peer communities in 2017 — for each labor market indicator — and how those
rankings have improved since 2015. The comprehensive 2018
Comparative Dashboard is currently available on our website.
American Community Survey (ACS) 1-year Estimates from 2015 were
ranked for each Combined Statistical Area (CSA) across the nation — for each of
our six labor market indicators — yielding both a national ranking and a peer
ranking for West Michigan as compared to the nation and its peer communities,
respectively. These 2015 rankings were then compared to those recorded in 2017,
allowing us to track progress in West Michigan against the nation and our peers,
across six indicators of a flourishing economy. Using the list of peer
communities that were identified in the 6th edition of our West
Michigan Talent Assessment and Outlook report allows us to better
understand and benchmark our region in comparison to similar areas throughout
the country. Each peer CSA is comparable to the 13-county West Michigan region
both in terms of population and industry makeup, as these areas have
populations within 30 percent of the Grand Rapids-Wyoming-Muskegon, MI CSA, as
well as over 10 percent of employment in Manufacturing. These 11 peer CSAs are:
- Birmingham-Hoover-Talladega, AL CSA
- Buffalo-Cheektowaga, NY CSA
- Dayton-Springfield-Sidney, OH CSA
- Greensboro-Winston-Salem-High Point, NC CSA
- Greenville-Spartanburg-Anderson, SC CSA
- Harrisburg-York-Lebanon, PA CSA
- Hartford-West Hartford, CT CSA
- Knoxville-Morristown-Sevierville, TN CSA
- Louisville/Jefferson County-Elizabethtown-Madison, KY-IN CSA
- Rochester-Batavia-Seneca Falls, NY CSA
- Tulsa-Muskogee-Bartlesville, OK CSA
Why Management, Business, Science, and the Arts?
While this is a relatively new metric used to assess the strength
of a labor market, the concentration of employment in occupations related to
Management, Business, Science and the Arts can indicate a lot about the viability
of a local economy. Not only are these fields typically associated with above-average
wages, but they are also becoming increasingly specialized — with technological
innovations continuously increasing the knowledge, skill, and ability requirements
of practitioners, which are highly correlated with educational attainment — and
also increasingly valued by advocates of the STEAM model.
Contrasting the traditional STEM model, this relatively new
approach to prepare younger generations for the emerging job markets of the
future focuses on the STEM fields of Science, Technology, Engineering, and Mathematics
— with an additional focus on the Arts. Proponents of the STEAM model argue
that it is no longer sufficient to acquire knowledge in these fields, as our
economy requires critical-thinking, application, and ingenuity to solve
increasingly complex problems. Thus, integration of the Arts in education and
training programs is a crucial, and previously absent, element necessary to
prepare kids for the job demands of the future.
Employment in Management, Business, Science, and Arts Occupations
Overall, 32.3 percent of adults aged 16 and over in West
Michigan were employed in a Management, Business, Science, or Arts occupation
in 2013. Comparatively, only the peer CSA of Greenville-Spartanburg-Anderson,
SC (32.1%) reported a lower concentration of employment in these fields than our
own, with 10 of our 11 other peer communities boasting a higher rate than West
Michigan at this time. While our region barely managed to claim the 11th
spot — edging out our peers in South Carolina by just over a tenth of a percentage
point — we still lagged our next-closest peer community by 0.8 percent. Reporting
the highest share of employment in these occupational categories, the CSA of Hartford-West
Hartford, CT surged ahead of its peers in 2013 with a rate of 41.2 percent for
this metric — exceeding the rate of the 2nd ranked peer CSA by 2.0 percent.
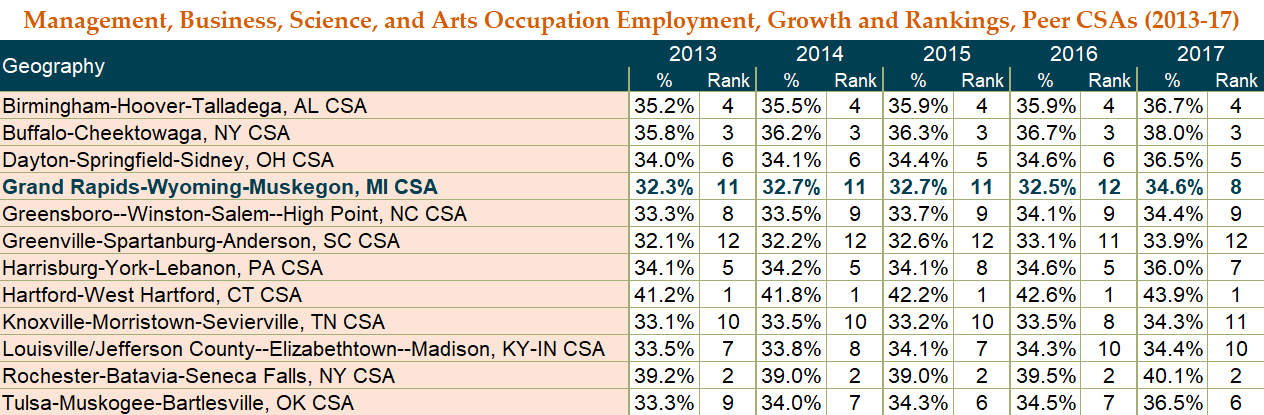
Despite a slight growth of 0.4 percent observed two years later
— with 32.7 percent of total employment concentrated in Management, Business, Science,
and Arts occupations in 2015 — our region’s ranking amongst its peer
communities remained largely unchanged. West Michigan now lagged behind the 10th
ranked peer CSA by 0.6 percent with respect to this metric, a two-year gain of
0.2 percent, but the gap between the
13-county region and its trailing peers in South Carolina (32.6%) significantly
lessened. Now, just over one-hundredth of a percentage point separated our
regional rate from that of the 12th ranked peer community.
Another two years later, in 2017, 34.6 percent of West
Michigan workers were now employed in a Management, Business, Science, or Arts occupation.
This two-year increase of 1.9 percent translated to a jump of 3 rankings relative
to our peers, bringing West Michigan’s rate to rank 8th among our 12
identified comparative communities. While our region previously trailed the 10th
ranked CSA of Knoxville-Morristown-Sevierville, TN in 2013 (33.1%) and again in
2015 (33.2%), our regional rate now exceeds theirs by over 0.3%. There is still
progress to be made if our region strives to claim the top spot amongst our
peers, however, with a gap of 9.3 percent remaining between West Michigan and
our leading peers in Connecticut.
Future Data Topics
Have you been enjoying these “Data Points” blogs and are
interested in other data? Let us know what topics you’d like to know more about
on our Twitter @WMTalent2025! We’d like to crunch some numbers that you’re
interested in!