How much does unemployment vary by race and ethnicity?
With an unemployment rate of nearly 4.5 percent for the region over the course of 2016, West Michigan was seemingly at full employment just two years ago. While this may have remained true in the aggregate, the level of unemployment within the region varied substantially depending on which racial or ethnic group was being assessed.
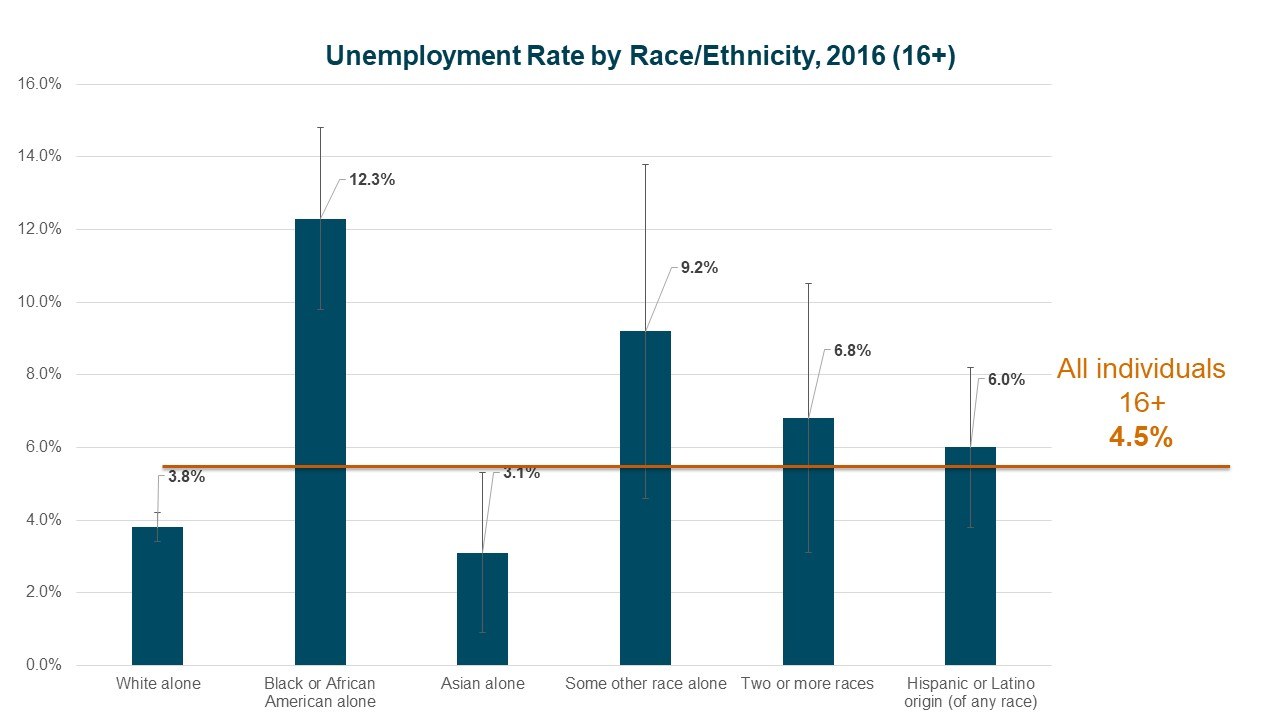
As evident by the figure above, unemployment rates varied significantly in West Michigan across racial groups in 2016, with the lowest rate observed for those who identified as Asian alone (3.1%) and the highest for those who identified as Black or African American alone (12.3%). Thus, the range between the racial groups with the highest and the lowest unemployment rates in West Michigan stood at approximately 9.2 percent just two years ago. Interestingly enough, this gap of 9.2 percent is illustrated in the figure above by the bar associated with the racial group with the second highest unemployment rate, those who identified as Some other race alone. In other words, the disparity in employment observed between the racial groups with the highest (Black/African American) and lowest (Asian) unemployment rates is equal to the unemployment rate of the second-most unemployed racial group, at 9.2 percent. Also of note is the fact that only two racial groups in West Michigan, those identifying as White alone or Asian alone at the time of the survey experienced unemployment rates that were below the regional average of 4.5 percent.
How much does labor force participation vary by race and ethnicity?
While it’s clear that race and ethnicity play a role in determining the unemployment rate of a population, how do these factors influence the labor force participation rate, or the portion of a population actively involved in the labor force (either employed or unemployed and actively seeking work)?
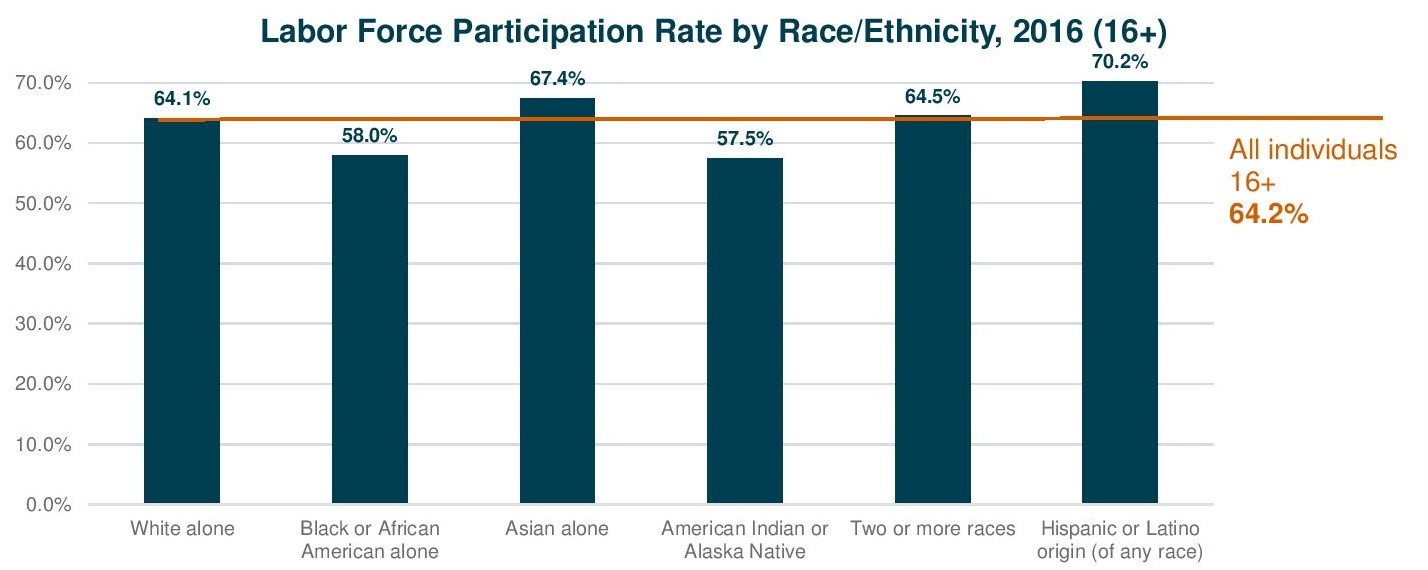
In 2016, 64.2 percent of all individuals over the age of 16 in West Michigan were actively involved in the labor force. At this time, the most participatory racial/ethnic group in the West Michigan labor force were those of Hispanic or Latino origin, with 70.2 percent of the respective population either employed or unemployed. Conversely, those who identified as American Indian or Alaska Native were the least involved in the regional labor force, at a rate of 57.5 percent. The racial group with the second lowest labor force participation rate were those who identified as Black or African American alone (58.0%), distantly followed by those identifying as White alone (64.1%). Although the gap between the racial groups possessing the highest and the lowest labor force participation rate is well above the range of 9.2 percent observed for unemployment rates, it would appear that these rates are more closely aligned with the regional average than those associated with unemployment.
Future Data Topics
Have you been enjoying these “Data Points” blogs? Are you interested in other data? Let us know what topics you’d like to know more about on our Twitter @WMTalent2025! We’d like to crunch some numbers that you’re interested in.