In support of the Annual Dinner held by the Economic Club of Grand Rapids, we have put together a data one-pager briefly illustrating our region’s economic outlook. Among our findings: low levels of unemployment have not been shared by all members of our communities, particularly for those in rural areas.
Unemployment rates vary in rural areas
Included in the expansive regional data we collected for the Economic Club, variations among unemployment rates — also commonly referred to as the “jobless rate” — were emphasized by several characteristics. Paralleling many other parts of the nation, unemployment rates in West Michigan were particularly high for residents of rural areas heading into the first quarter of 2018. This is a trend which appears to continue into April, according to the preliminary data released by the U.S. Bureau of Labor and Statistics. While West Michigan, overall, averaged a first quarter unemployment rate of approximately 4.41 percent for 2018 — representing a slight increase when compared to the rate of 4.37 percent observed for the first quarter of the previous year — the range among counties encompassed within the region is quite stark in contrast.
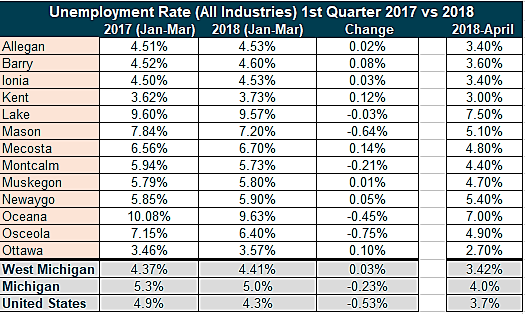
Lake County came in seated with the highest unemployment rate observed for the first quarter of 2018 at a little over 9.5 percent. Although this jobless rate was the highest of the 13 counties included in West Michigan during this period, it does represent a minor decrease from the rate recorded in the first quarter of the previous year. Despite this, the preliminary results for April of 2018 are consistent with first quarter rankings, placing Lake County with the highest unemployment rate in West Michigan. On the other end of the spectrum, Ottawa County consistently ranks in with the lowest jobless rate in West Michigan for both the first quarter of 2018 and according to April’s preliminary results. Despite having the lowest unemployment rate, the slight one-year increase observed for the county would appear to indicate that more people are entering the labor force in this area. Or, as commonly interpreted, that more people in this area have recently been unemployed when compared to the first quarter of last year.
Future Data Topics
Have you been enjoying these “Data Points” blogs? Are you interested in other data? Let us know what topics you’d like to know more about on our Twitter @WMTalent2025! We’d like to crunch some numbers that you’re interested in.