Often when Talent 2025 receives a request for data, it is about the regional labor force. Who is working in West Michigan? How does this vary by industry? Is the workforce getting older? Younger? More educated?
Fortunately, a dataset from the U.S. Census Bureau allows us to answer these questions and many more using the Quarterly Workforce Indicators data set.
What is QWI?
The Quarterly Workforce Indicators (QWI) are derived from Longitudinal Employer-Household Dynamics (LEHD) data, which links employees and employers to be able to track more granular characteristics. This is the result of federal-state partnerships which allow this data to be shared between local and federal Census programs, and is also the basis for the information behind the OnTheMap tool, discussed previously on this blog.
West Michigan Industries by Age
A frequent topic of conversation is the aging of the workforce, an issue that is both local to our area as well as throughout the country Selecting some of the largest counties in our region (otherwise, the data becomes too granular and is held back in the QWI tool), we can begin to get a picture of what the workforce looks like overall…
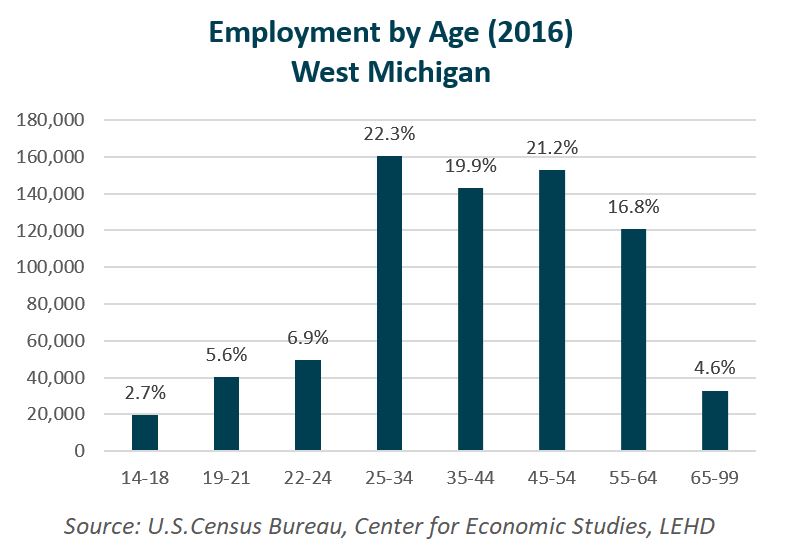
…and on an industry level. Here’s we can see the percentage of each industry’s workforce that is below 35 (mostly individuals early in their careers) and those who are beginning to near retirement age.

As the mass retirement of those workers who are in the Baby Boomer generation continues over the next decade, it will be important for industry and other regional leaders to note which sectors of the economy will be most impacted by the retirement of experienced individuals.
Exploring Diversity in Employment
Another topic that the QWI data set allows us to explore (and is relevant to Talent 2025’s ILD event on January 30th ) is racial and ethnic diversity in the workforce. Again, this can be done on the industry level, or even as a time series to see the change in employment for different racial or ethnic groups.
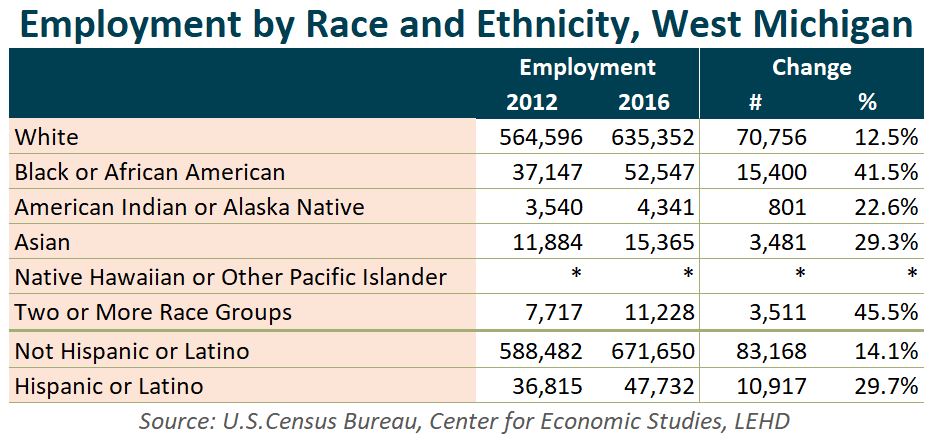
Here, we pull the annual average employment in West Michigan by race and ethnicity for 2016 and 2012 so we can calculate the change over the last five years. What do we learn? Proportionally, employment levels by non-white individuals in the region has been growing rapidly, with Black or African Americans employed in the region growing at over 8 percent annually.
Future Data Topics
Have you been enjoying these “Data Points” blogs and are interested in other data? Let us know what topics you’d like to know more about on our Twitter @WMTalent2025! We’d like to crunch some numbers that you’re interested in!