Although we’ve discussed the effects of race, gender, and age on the labor force participation rate and unemployment rate of a population in previous posts, we have yet to explore how these indicators vary between veterans and nonveterans across the region. In today’s post, we will look at pockets of high unemployment and low labor force participation rates for veterans across the 13-county West Michigan region.
How much does employment vary by veteran status?
In 2016, West Michigan’s thirteen counties contained just over 960,000 residents between the ages of 18 and 64 — 4.6% of whom were veterans, equating to over 44,000 veterans scattered across the region just two years ago. The highest concentrations of veterans were found in Newaygo (7.4%), Osceola (7.3%) and Lake (6.4%) counties, while Kent (3.8%), Ottawa (3.9%), and Allegan (4.3%) counties attracted the fewest number of veterans, proportionately.
Overall, for the population aged 18 to 64, the unemployment rate for veterans residing in West Michigan during 2016 was slightly higher than the rate associated with nonveterans, standing at 7.0% and 6.7%, respectively. While this 0.3% difference may seem insignificant in the aggregate, there were large variations in the unemployment rates of veterans and nonveterans across county boundaries. The counties where veterans experienced the highest unemployment rates in 2016 included Lake (15.1%), Mecosta (14.3%), and Osceola (12.1%) counties, yet two of these counties (Lake and Osceola) were among the top three counties in West Michigan with the highest concentration of veterans. Nonveteran residents also experienced comparatively high unemployment rates in Lake and Mecosta counties, though at lower rates than their veteran counterparts — with unemployment rates of 12.6% and 10.3%, respectively. Although Muskegon county held the second highest unemployment rate for nonveteran residents (10.7%), its unemployment rate of 7.6% for veterans ranks 6th of the 13th counties encompassed in West Michigan.
How much does labor force participation vary by veteran status?
For the population aged 18 to 64 residing in West Michigan in 2016, the labor force participation rate for veterans was nearly 6.4% lower than the rate attributed to nonveterans, standing at 71.8% and 78.2%, respectively. Unlike the rates associated with unemployment, however, labor force participation rates for veterans were consistently below their nonveteran counterparts.
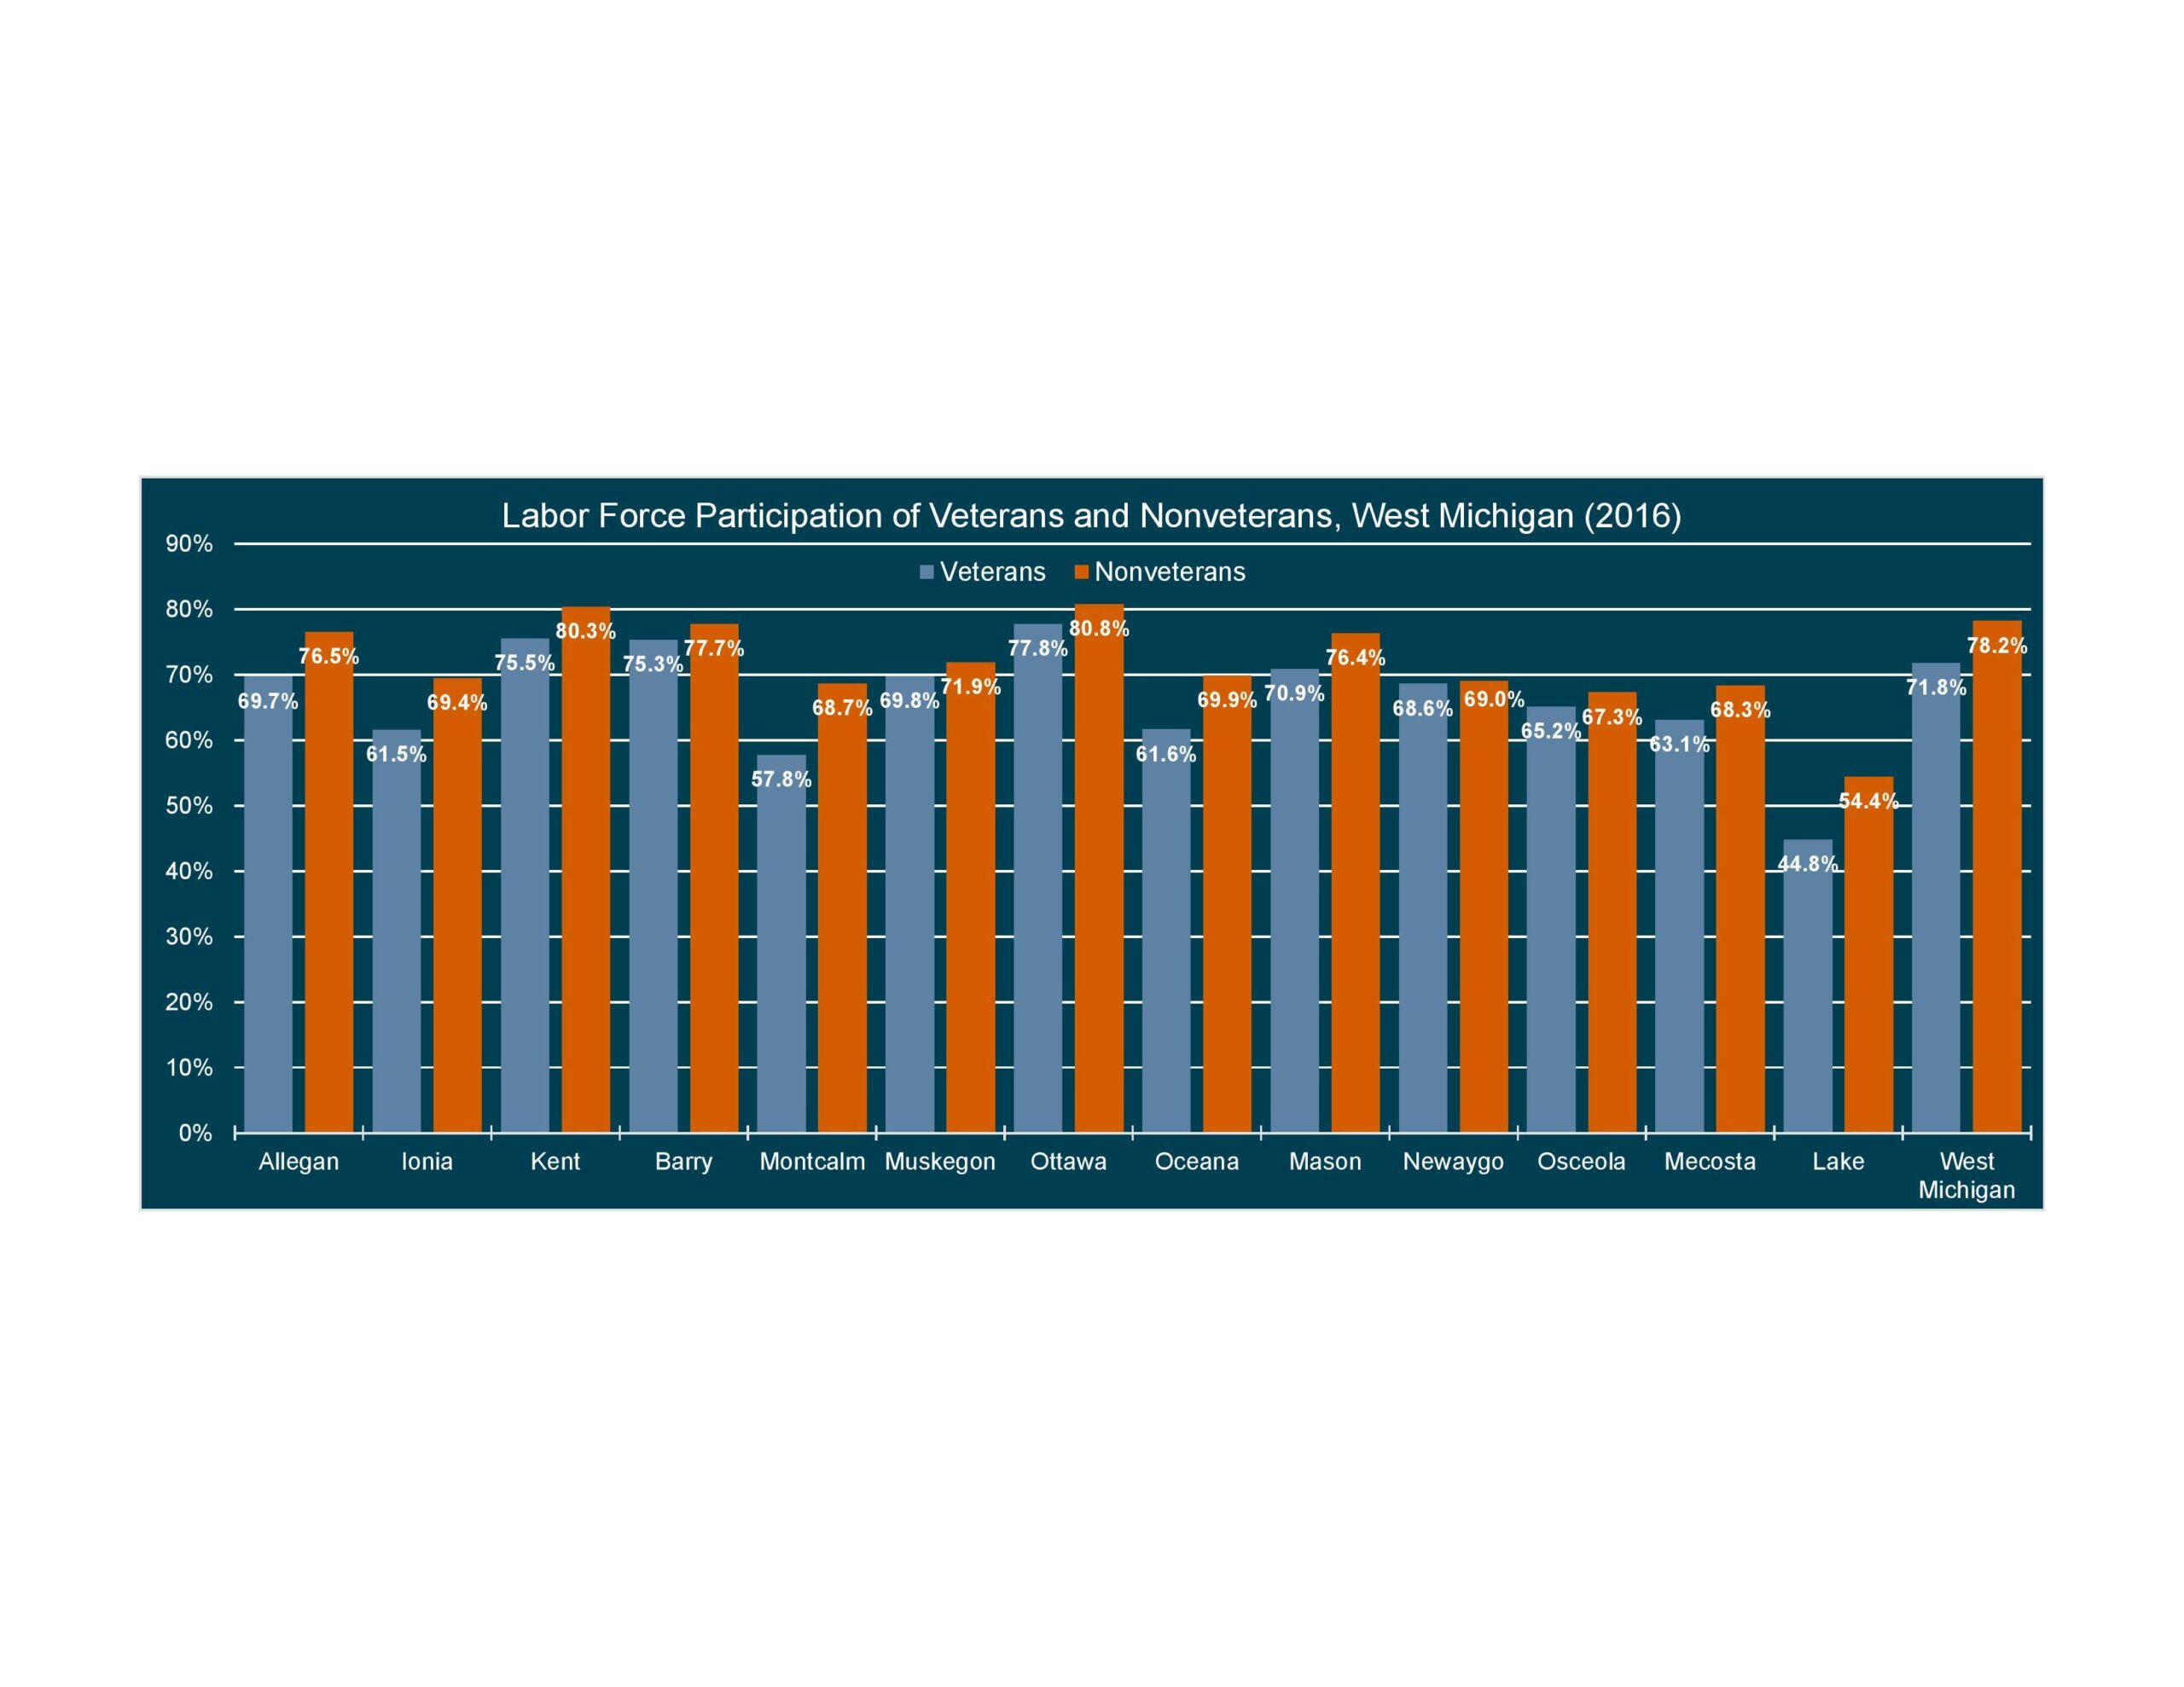
In each of the 13 counties included in the West Michigan region, the labor force participation of the nonveteran population exceeded the participation of veterans. The gap in labor force participation observed between veterans and nonveterans was the smallest in Newaygo county, with only a 0.4% difference in participation between the two populations. Conversely, this gap was just under 11% in Montcalm county, the highest observed of any county in West Michigan.
Future Data Topics
Have you been enjoying these “Data Points” blogs? Are you interested in other data? Let us know what topics you’d like to know more about on our Twitter @WMTalent2025! We’d like to crunch some numbers that you’re interested in.