Much of the data we discuss on this blog comes from federal or state sources and are macroeconomic measures of our region. Today, we’re going to use a local source of data to dig into a topic that is very important to the work of Talent 2025.
What are childcare deserts?
A childcare desert, broadly defined, is an area where the supply of spots for children at group or home-based childcare isn’t sufficient for the demand in that area. This can lead to a number of negative outcomes, including families paying unsustainable portions of their household income to childcare, parents having transportation issues getting their child to a childcare provider further away, or more children being placed in childcare situations that are below necessary safety standards.
Because of these negative impacts, it is important for decision-makers to know what areas need more attention when it comes to developing affordable childcare. The online tool from IFF makes this possible.
How does the map resource work?
After pulling up the online tool in your internet browser, you can see two main data layers on the map. First, neighborhoods are filled in with a variety of blue classifications based on need, which is measured by the service gap between supply and demand. On the second layer we see markers in the locations of childcare providers, which are color-coded according to their GSQ (Great Start to Quality) rating, and are different shapes according to what type of provider they are.
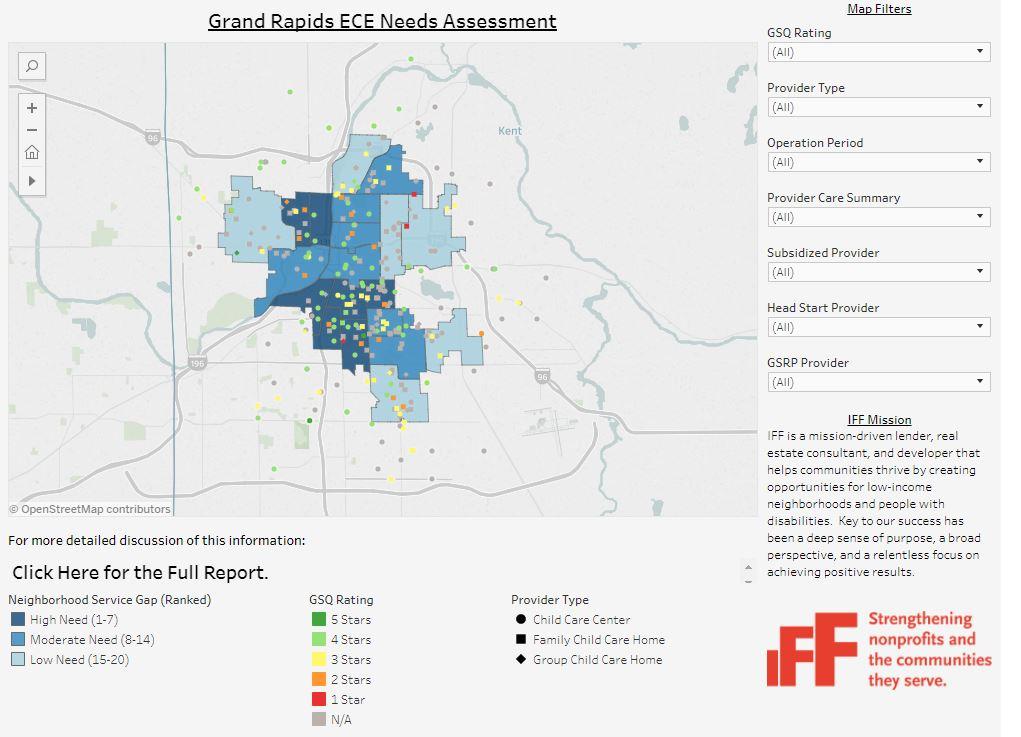
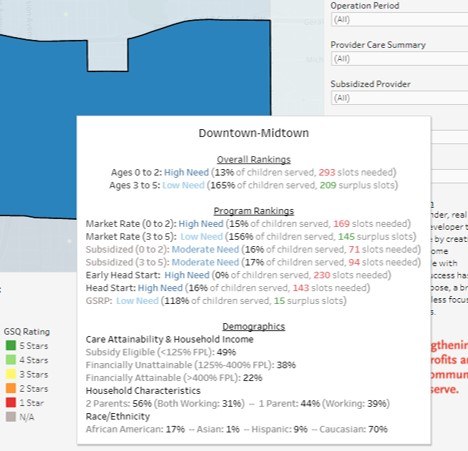
When viewed in Tableau, the map can be altered to include or exclude certain provider types, GSQ levels, and more. IFF has made this tool even more valuable by allowing users to hover over certain areas to see a more detailed breakdown of the demographics in neighborhoods, as well as the need level by program and age.
Data such as these can help illuminate the problem, which is the first step toward evaluating possible solutions and advocating for best practices. IFF recently prepared a report called “A System for All Children: An Early Childhood Education Needs Assessment in Grand Rapids” which has plenty of helpful analysis about these data. Be sure to check it out on their website.
Future Data Topics
Have you been enjoying these “Data Points” blogs and are interested in other data? Let us know what topics you’d like to know more about on our Twitter @WMTalent2025! We’d like to crunch some numbers that you’re interested in!