In an effort to better track progress over time, Talent 2025 selected six key performance indicators to measure the economic conditions of West Michigan against those of 11 identified peer communities. This composes our 2018 Comparative Dashboard, which illustrates how West Michigan ranked amongst its peer communities in 2017 — for each labor market indicator — and how those rankings have improved since 2015. The comprehensive 2018 Comparative Dashboard is currently available on our website.
American Community Survey (ACS) 1-year Estimates from 2015 were ranked for each Combined Statistical Area (CSA) across the nation — for each of our six labor market indicators — yielding both a national ranking and a peer ranking for West Michigan as compared to the nation and its peer communities, respectively. These 2015 rankings were then compared to those recorded in 2017, allowing us to track progress in West Michigan against the nation and our peers, across six indicators of a flourishing economy. Using the list of peer communities that were identified in the 6th edition of our West Michigan Talent Assessment and Outlook report allows us to better understand and benchmark our region in comparison to similar areas throughout the country. Each peer CSA is comparable to the 13-county West Michigan region both in terms of population and industry makeup, as these areas have populations within 30 percent of the Grand Rapids-Wyoming-Muskegon, MI CSA, as well as over 10 percent of employment in Manufacturing. These 11 peer CSAs are:
- Birmingham-Hoover-Talladega, AL CSA
- Buffalo-Cheektowaga, NY CSA
- Dayton-Springfield-Sidney, OH CSA
- Greensboro-Winston-Salem-High Point, NC CSA
- Greenville-Spartanburg-Anderson, SC CSA
- Harrisburg-York-Lebanon, PA CSA
- Hartford-West Hartford, CT CSA
- Knoxville-Morristown-Sevierville, TN CSA
- Louisville/Jefferson County-Elizabethtown-Madison, KY-IN CSA
- Rochester-Batavia-Seneca Falls, NY CSA
- Tulsa-Muskogee-Bartlesville, OK CSA
Growth in the Overall Median Household Income
When compared to our eleven other identified comparison areas over the period from 2013 to 2017, West Michigan led its peers in growth when considering the median household income of all residents — as well as for residents who identified among four racial and ethnic categories. Translating to a five-year increase of approximately $5,647, West Michigan experienced an overall growth rate of nearly 11.3% to the region’s median household income in the time since 2013. Although this was the largest five-year growth rate observed among any of our peer communities — edging out our second-ranked peer CSA, in terms of growth, by over 1 percentage point (Louisville/Jefferson County…Madison, KY-IN; 10.3%) — West Michigan’s peer ranking still only increased by 1 position over this 5-year time span, to stand at 3rd in 2017 with an overall median income of $55,749.
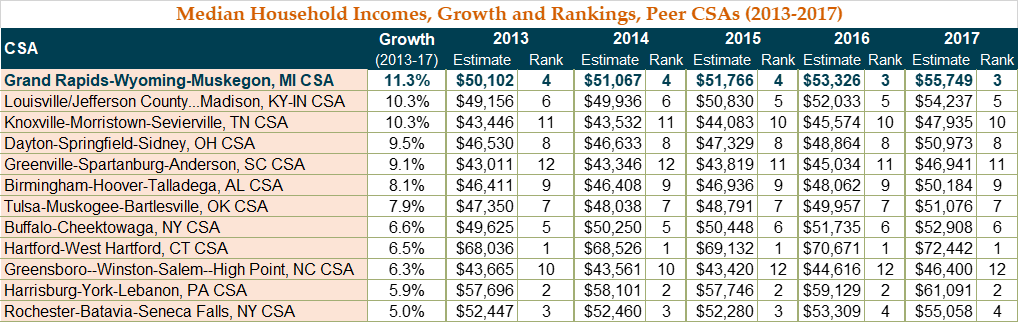
In 2016 the 13-county West Michigan region managed to overtake its peers in Rochester-Batavia-Seneca Falls, NY to claim the 3rd peer ranking, when considering the median household income of all residents in an area. There’s still a long way to go if the region strives to claim the top spot amongst its peer communities, however, with a gap of $16,693 remaining between the overall median household income of West Michigan and its top-ranked peer in Connecticut ($72,442; 2017). Furthermore, despite experiencing the lowest growth rate of our eleven other peer CSAs, the overall median household income of our second-ranked peer in Pennsylvania ($61,091; 2017) still exceeds that of West Michigan by nearly $5,342.
Median Household Income Growth: Does Race Matter?
The correlation between an individual’s income level and racial and ethnic identity is well documented, and the data provided by the American Community Survey would appear to support to this argument. As such, it should come as no surprise that the median incomes associated with West Michigan’s White and Asian households consistently exceeded the median of all households across the region, throughout the period from 2013 to 2017. Yet despite experiencing the largest overall growth to this metric when compared to our eleven peer CSAs, West Michigan residents did not experience income growth evenly across racial and ethnic categories — which may present serious implications when considering the trajectory of the income gap.
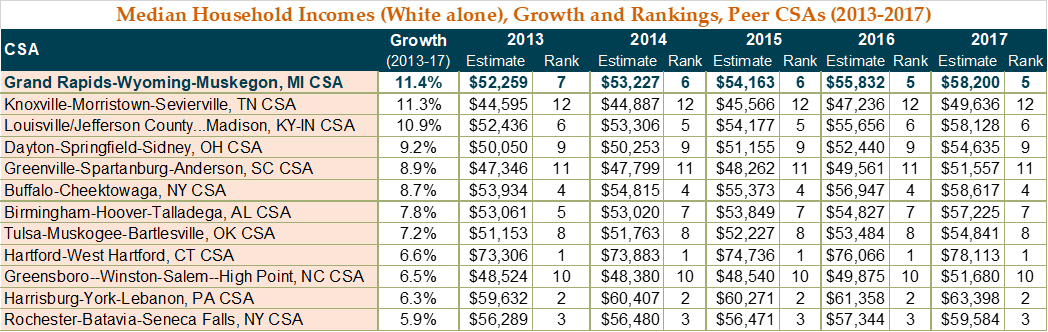
While the median income of all West Michigan households increased by $5,647 (11.3%) over this five-year duration, the median income for white households alone rose at a slightly higher rate to reach $58,200 in 2017. This translates to an increase of $5,941, a growth rate of just under 11.4% and the largest of any peer community, and surpasses the overall median household income of the 13-county region by $2,451. Despite leading our peers in growth with respect to the median income of white households, West Michigan’s peer ranking only increased by 2 positions for this metric, from 7th in 2013 to stand at 5th in 2017. In comparison, the median income for white households in Knoxville-Morristown-Sevierville, TN — ranked second in terms of growth for this metric — increased by just under 11.3% ($5,041) over the same period.
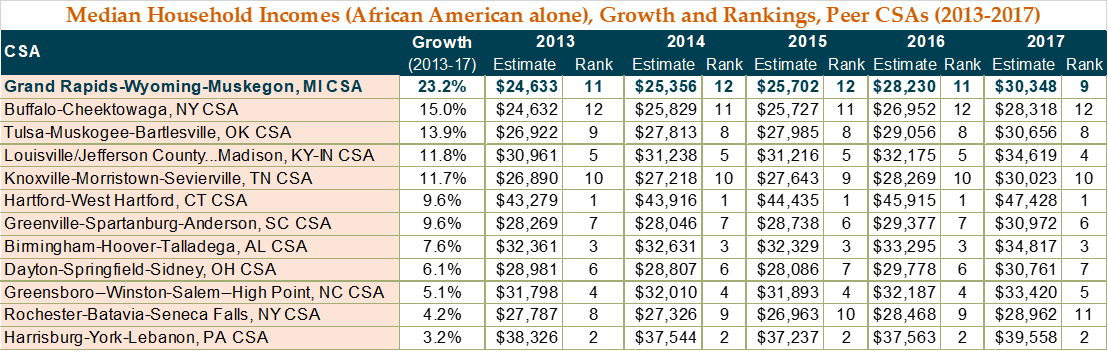
The median income of African American households in West Michigan also saw the largest growth relative to our peer communities over this five-year time span. At a rate of 23.2%, the median income of African American households in our region grew by $5,715 in the time since 2013, to reach $30,348 in 2017. Although this value still remains $25,401 shy of the median income associated with all households across the 13-county region, and still trails the median income of white households by $27,852, this growth resulted in a peer rank increase of 2 positions with respect to this metric — bringing West Michigan’s peer ranking from 11th in 2013 to 9th in 2017. In comparison, the second-largest growth to the median income of African American households was attributed to our peers in Buffalo-Cheektowaga, NY with an increase of 15.0%, or $3,686.
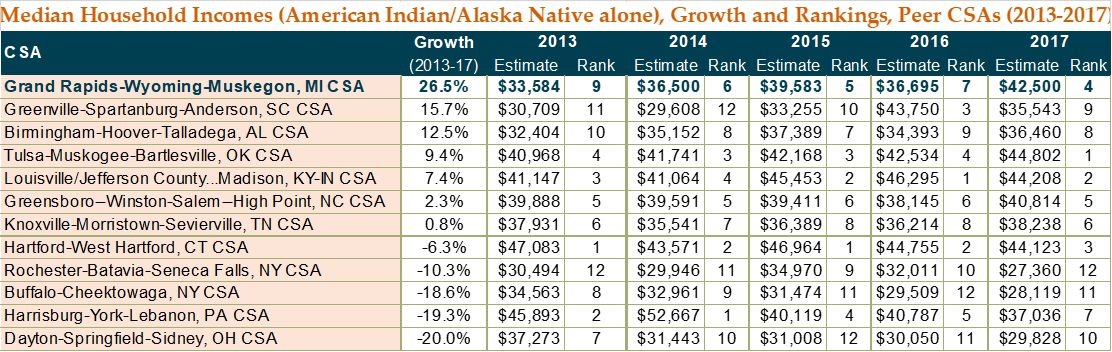
Following a similar trend, American Indian and Alaska Native households in our region also experienced the largest growth to their median income when compared to our peers over this period. The median income attributed to these households in West Michigan rose from $33,584 in 2013 to reach $42,500 in 2017, a five-year increase of $8,916 (26.5%). Despite a remaining gap of $13,249 in comparison to the median income of all households across our region — and an even larger gap of $15,700 when compared to white households — growth in West Michigan exceeded the growth of our next-closest peer community by nearly 11% for this metric. Furthermore, this was the largest growth-rate observed to the median income of any racial or ethnic household located across West Michigan over this period, with African American households slightly trailing at 23.2% and Hispanic/Latino households close behind at 22.5%.
Future Data Topics
Have you been enjoying these “Data Points” blogs and are interested in other data? Let us know what topics you’d like to know more about on our Twitter @WMTalent2025! We’d like to crunch some numbers that you’re interested in!