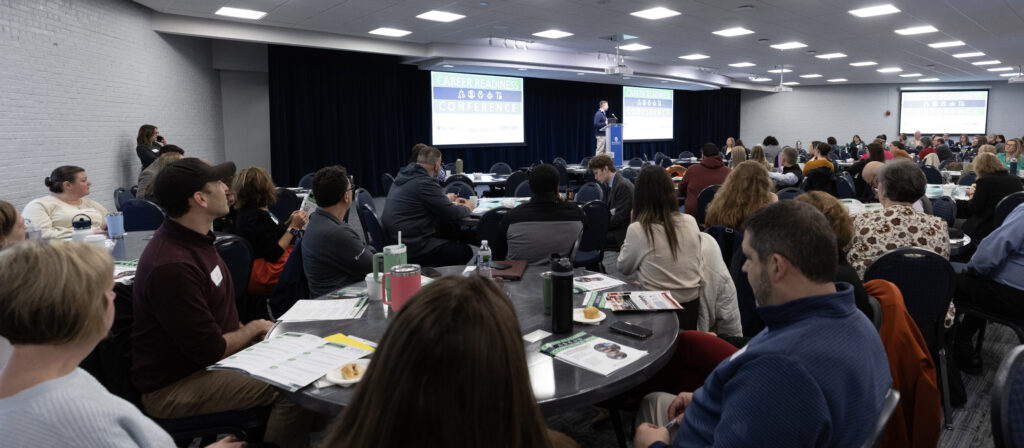
The Brookings Institute, based in Washington DC, is a terrific resource for many types of workforce and economic data. One of those resources, the Metro Monitor, adds together a variety of success indicators that fall under three broad buckets: economic growth, regional prosperity, and inclusion. These three topics, and all the measures which fit into them, are collected for the top 100 metropolitan areas in the United States based on population; in the West Michigan region, this includes the Grand Rapids-Wyoming metropolitan area (that is: Barry, Kent, Montcalm, and Ottawa counties).
How does West Michigan measure up?
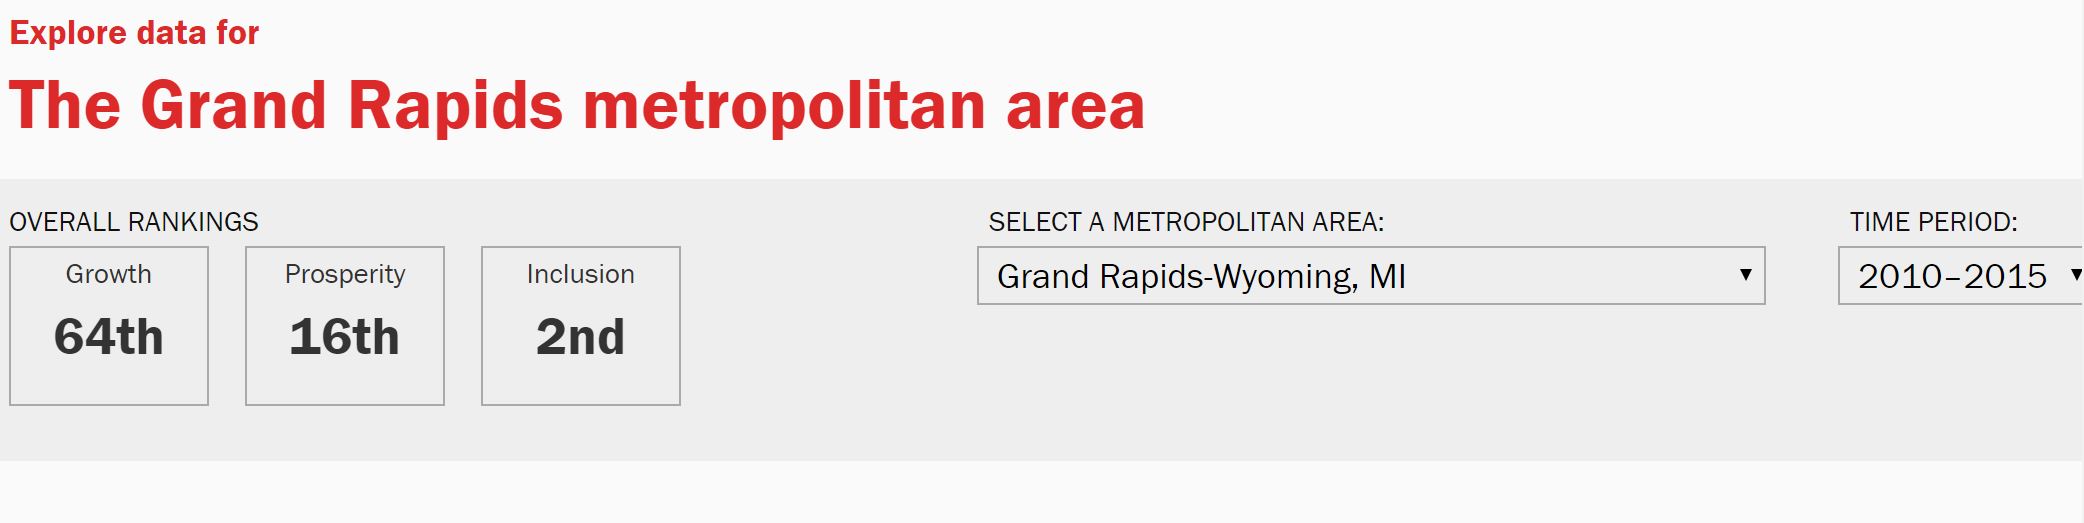
Looking at the data for the Grand Rapids metro area from 2010 to 2015, the Metro Monitor shows the region ranking 64th in growth, 16th in prosperity, and 2nd in inclusion out of the 100 largest metro areas.
The lower rank in growth is actually the result of three underlying indicators, two of which rank in the top 25 nationally. Jobs grew by 15.9% in the metro area from 2010 to 2015, ranking 12th out of 100, and the gross metropolitan product (GMP) grew by 14.4%, good enough for 21st. However, jobs at young firms fell by 36.7% over the five-year period, ranking last of the largest 100 metro areas.
With regards to prosperity, while Grand Rapids ranked below average for productivity growth (productivity fell by 1.3% between 2010 and 2015, ranking 65th), the region was 16th for change in standard of living, which increased by 9%. Finally, the average annual wage in the region rose by 8.9% between 2010 and 2015, the 6th highest growth seen out of the largest 100 metro areas.
Grand Rapids ranks second best in the nation with regards to inclusion, which looks at the differences between races and ethnicities in three indicators: the employment rate, median wage, and relative poverty. In these areas, Grand Rapids ranks 3rd, 5th, and 17th respectively.
What can I do with this information?
Data is helpful, but turning that data into actionable information is key to its value. The Metro Monitor is a valuable source for comparative indicators because of how easy it is to access and use. Talent 2025 is also committed to tracking system-level indicators about the region to help guide the progress and direction of our various working groups.
Check out our dashboard and our system map to see where West Michigan as a whole region stands.