Although they are often perceived as a simplified look into the vitality of a labor market, the unemployment rate and labor force participation rate within a region are among the most pervasive indicators of economic prosperity utilized today. While both metrics referenced above have continued to improve in West Michigan since the end of the Great Recession in 2009, it is important to note that such progress has not been distributed evenly among all members of our community. In today’s post, we will explore pockets of high unemployment and low labor force participation across racial and ethnic subpopulations within West Michigan, as revealed by data taken from the latest 2018 American Community Survey (ACS).
Quantifying Employment Gaps
With an unemployment rate of 3.4% in 2018, a marked improvement from the 12.5% unemployment observed for the region in 2009, it might appear that all West Michigan residents are thriving. While this may seem true in the aggregate, the rate of unemployment within the region varies substantially across racial and ethnic subpopulations, with additional gaps resulting from gender and age disparities. Just 4.3% of West Michigan labor force participants who identified as White Alone in 2018 were considered unemployed, while unemployment among labor force participants identifying as Black or African American Alone remained over three times as high, at 13.0%. This would equate to an unemployment rate gap of 8.7% between White Alone residents and Black or African American Alone residents of West Michigan just two years ago, which significantly exceeds the respective gap of 2.8% associated with Hispanic or Latino (of any race) residents — with an unemployment rate of 7.1% that year.
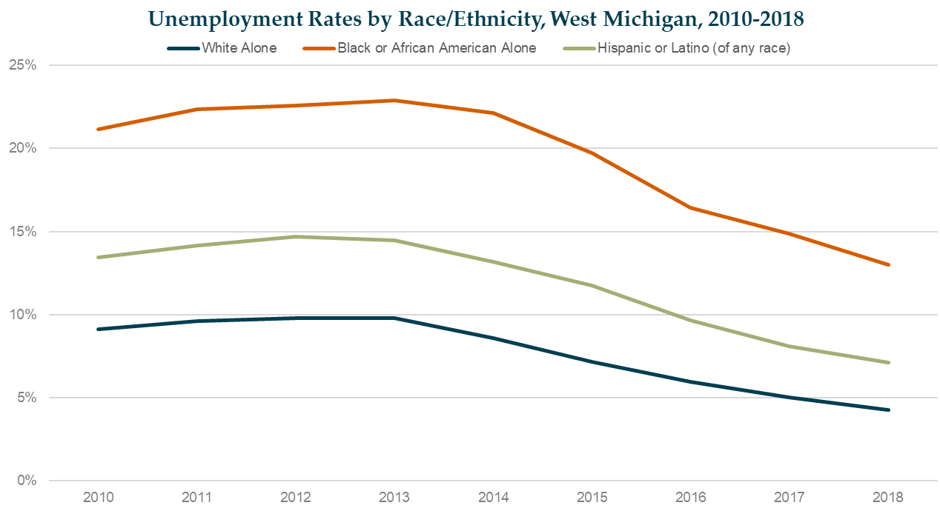
While racial and ethnic disparities across employment may come as no surprise, considering the existing body of research on racial and ethnic unemployment rate gaps, it is notable that such disparities show evidence of narrowing in West Michigan. The unemployment rate gap between White Alone and Black or African American Alone residents peaked at 13.5% in 2014, while the comparable gap associated with Hispanic or Latino (of any race) residents peaked at 4.9% in 2012. Considering the size of the respective unemployment rate gaps in 2018, this would reflect a narrowing of 4.8% to the unemployment rate gap between White Alone and Black or African American Alone residents of West Michigan over the identified 4-year timespan. Additionally, this would equate to a 6-year improvement of 2.1% to the unemployment rate gap between White Alone and Hispanic or Latino (of any race) West Michigan residents. Although progress has been gradual across a region with over 1.6 million residents, the narrowing of these employment gaps has emerged despite the countervailing forces presented by increased labor force participation among Black or African American Alone and Hispanic or Latino (of any race) residents, and decreased participation among White Alone residents, observed over the respective time periods.
Quantifying Gaps in Labor Force Participation
While it’s clear that race and ethnicity play a role in determining the unemployment rate of a population, it would appear that substantial gaps also persist among West Michigan residents with respect to the labor force participation rate of diverse communities, or the portion of the total subpopulation engaged in the labor force (either employed, or unemployed and actively seeking work). In West Michigan, 63.9% of residents who identified as White Alone in 2018 were actively involved in the labor force, compared to 60.0% for Black or African American Alone, and 71.9% for Hispanic or Latino (of any race). This would equate to a gap of 3.9% between the labor force participation rates of White Alone and Black or African American Alone residents of West Michigan, just two years ago, while the rate associated with Hispanic or Latino (of any race) labor force participants exceeded White Alone participants by 8.0%.
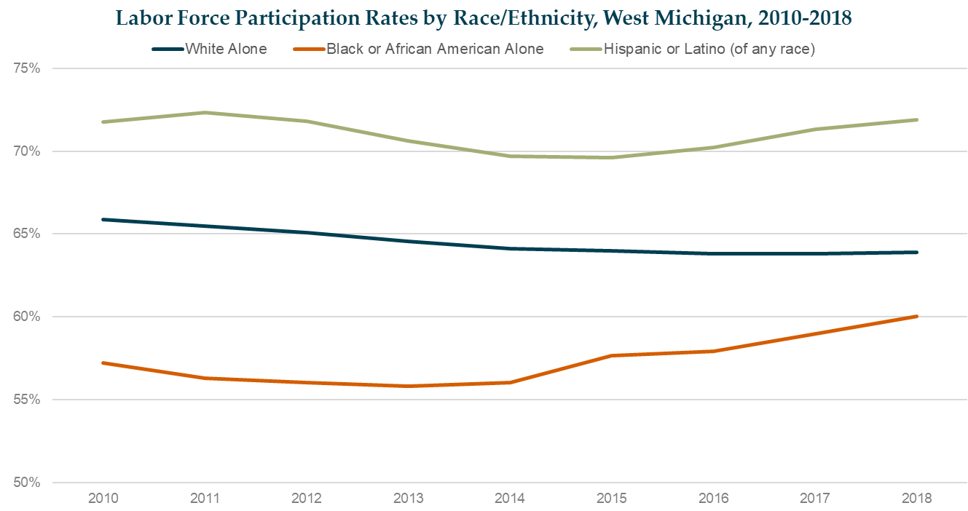
Comparing 2018 labor force participation rates to the same rates observed across racial and ethnic subpopulations within West Michigan in 2010 would indicate that racial and ethnic gaps in labor force participation have generally followed the same narrowing trend observed across unemployment. Indeed, West Michigan’s labor force participation rate gap between White Alone and Black or African American Alone residents peaked at 9.2% in 2011, reflecting a 7-year improvement of 5.3% to achieve the region’s current gap of 3.8% (2018). However, it would appear this gap has widened when comparing the labor force participation rates of White Alone residents to that of the Hispanic or Latino (of any race) community, with the latter subpopulation yielding the highest labor force participation rate of any racial or ethnic community within West Michigan, as recently as 2018 (71.9%). The respective labor force participation rate gap achieved its lowest point in 2014, at 5.6%, at the same time when labor force participation among West Michigan’s Hispanic or Latino (of any race) residents plummeted to a low of 69.7%. Mirroring the positive recovery in labor force participation observed among Hispanic or Latino (of any race) residents over the 4-year duration since 2014, while also capturing the inverse trend observed for participation among White Alone residents, this gap has steadily increased in West Michigan and now exceeds the level recorded in 2010 by over 2.1% (5.9% gap, 2010).
Future Data Topics
Have you been enjoying these “Data Points” blogs? Are you interested in other data? Let us know what topics you’d like to know more about on our Twitter @WMTalent2025! We’d like to crunch some numbers that you’re interested in.